OppHub America Desk · · Source: yahoo-tickers-tape-movers
US Markets Slide: S&P 500 Falls 1.32% as VIX Spikes 13.62%
Monitor volatility benchmarks and cross-asset rate movements as broader equities navigate risk-off pressure.
Based on reporting from yahoo-tickers-tape-movers.
U.S. equities pulled back across major benchmarks on Thursday, November 19, 2026, as the S&P 500 dropped 1.32% to 7,226.88 and market volatility surged. Investors navigated broad risk-off positioning alongside rising bond yields and defensive flows.
Market context for this story
As of: Regular HoursLoading quotes…
Informational only — not investment advice. Full markets →
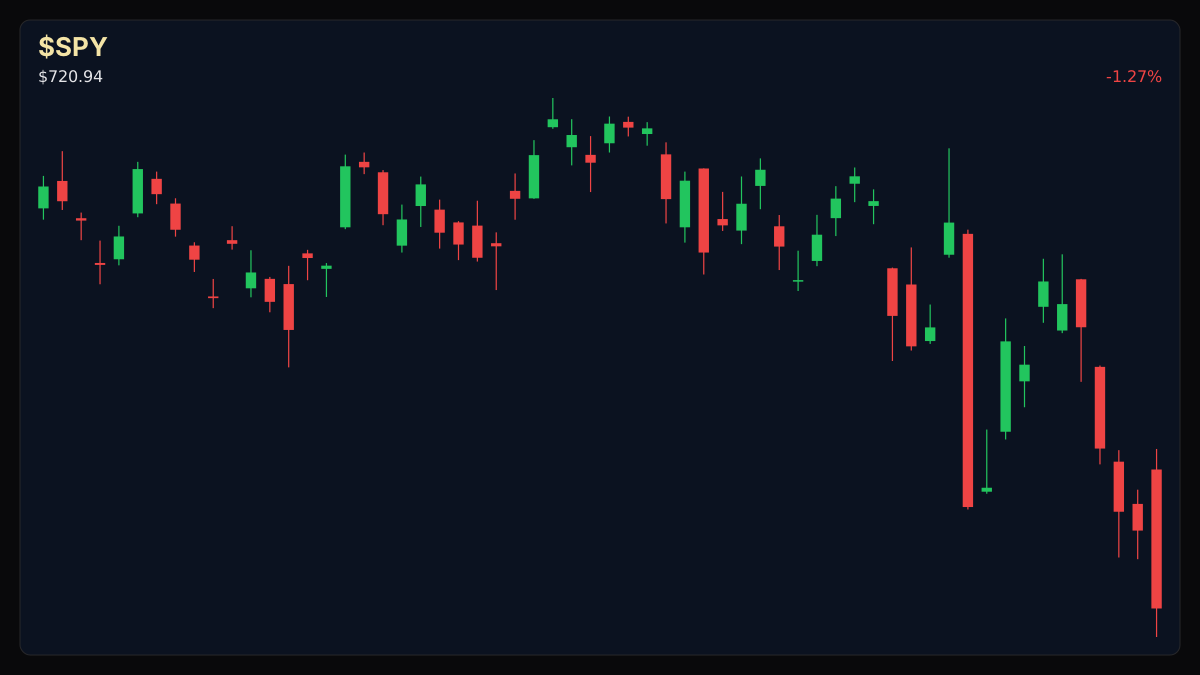
 SPDR S&P 500 ETF·$SPY
$SPYSPDR S&P 500 ETF
TradingView
Live chart & market data via TradingView · OppHub classroom · Delayed or exchange real-time per TradingView data agreements · Not investment advice
Educational TradingView chart — search any symbol in the widget. Confirm on /markets/SPY. Not investment advice.
Related markets
Shares a vertical MP4 loop to your phone's camera roll or app share sheet (Instagram, TikTok, Facebook Reels).
### Tape / Session Read U.S. equity benchmarks faced broad selling pressure on Thursday, November 19, 2026. The S&P 500 declined 1.32% (-96.75 points) to close at 7,226.88, while the Dow Jones Industrial Average dropped 1.63% (-820.15 points) to 49,378.02. The Nasdaq composite retreated 1.34% (-327.80 points) to 24,102.09, and the Russell 2000 small-cap index slid 1.67% (-45.30 points) to 2,669.00. Across asset classes, the Cboe Volatility Index (VIX) jumped 13.62% (+3.34 points) to 27.90, reflecting heightened defensive positioning as the 10-year Treasury bond yield hovered near 5.06% (-0.16%).
### Why This Lane Matters The broad-based pullback highlights shifting macroeconomic sentiment and heightened volatility across asset classes. Rising bond yields paired with surging volatility point to a reallocation of risk capital, impacting near-term sentiment for major risk assets.
### Money Play Market participants tracking broader index exposure should monitor macro risk indicators and volatility gauges as equities navigate cross-asset adjustments. No specific single-name tickers are designated for this tape session.
## $SPY+WL Technical Analysis & Key Risk Watch — LIVE MARKET CONTEXT for the lane ETF only
77.54 · R1 ## $SPY+WL Technical Analysis & Key Risk Watch — LIVE MARKET CONTEXT for the lane ETF only 63.20 · last ## $SPY+WL Technical Analysis & Key Risk Watch — LIVE MARKET CONTEXT for the lane ETF only 56.14 · S1 ## $SPY+WL Technical Analysis & Key Risk Watch — LIVE MARKET CONTEXT for the lane ETF only 55.01 · S2 ## $SPY+WL Technical Analysis & Key Risk Watch — LIVE MARKET CONTEXT for the lane ETF only 48.80.
Broad market participants are monitoring key support zones following the session's 1.32% contraction in the S&P 500, with volatility expansion signaling heightened defensive hedging across U.S. institutional portfolios.
Read the full story
Original reporting and related coverage — attribution links only, not paid recommendations.
Trade this story
 Robinhood
 Webull
 Tradier
 IBKR
Chart this story
 TradingView
Broker and exchange buttons use invite / refer-a-friend links (rewards may be capped). Charting links (TradingView) are partner offers that may pay OppHub America a commission at no extra cost to you.
OppSHOP
Full OppSHOP →As an Amazon Associate, OppHub America earns from qualifying purchases. Shopping here helps keep the site free — at no extra cost to you. Disclosure

OppSHOP
Related to this story
Monitor volatility benchmarks and cross-asset rate movements as broader
Shop related →

Investing books
Read the classics
Shop this pick →

Personal finance books
Run the household books
Shop this pick →

Trading notebooks
Write the thesis first
Shop this pick →

Monitor for charts
See every pane
Shop this pick →
Based on reporting from yahoo-tickers-tape-movers.
Informational and educational only — not investment, financial, or legal advice. Disclosure
Shares a vertical MP4 loop to your phone's camera roll or app share sheet (Instagram, TikTok, Facebook Reels).