OppHub America Desk · · Source: yahoo-tickers-tape-movers
US Markets Tape: S&P 500 and Nasdaq Gain as Dow Dips
As broader index levels shift alongside benchmark Treasury yields, market participants track cross-asset indicators and sector rotation dynamics without relying on single-name catalysts.
Based on reporting from yahoo-tickers-tape-movers.
U.S. equities split on Monday, October 5, 2026, as the S&P 500 and Nasdaq advanced while the Dow Jones Industrial Average dipped amid rising Treasury yields. Investors and traders monitored shifting sector leadership across major index benchmarks.
Market context for this story
As of: Regular HoursLoading quotes…
Informational only — not investment advice. Full markets →

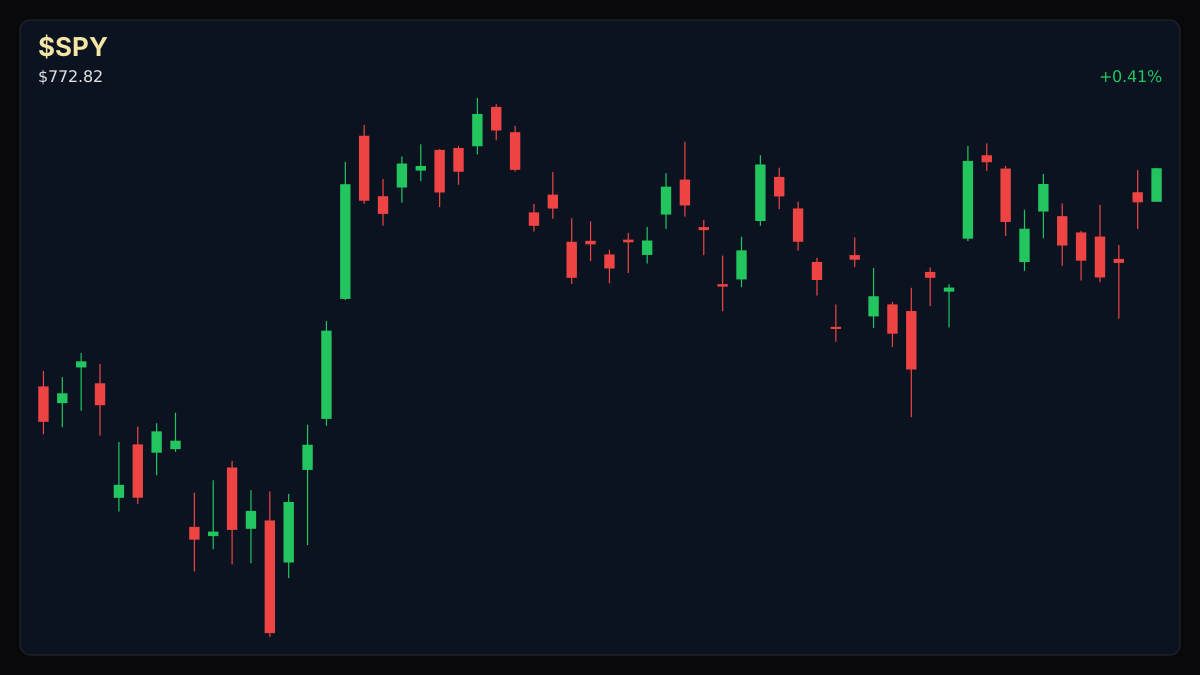
$SPYSPDR S&P 500 ETF
TradingView
Live chart & market data via TradingView · OppHub classroom · Delayed or exchange real-time per TradingView data agreements · Not investment advice
Educational TradingView chart — search any symbol in the widget. Confirm on /markets/SPY. Not investment advice.
Related markets
Shares a vertical MP4 loop to your phone's camera roll or app share sheet (Instagram, TikTok, Facebook Reels).
### Tape / Session Read During the trading session on Monday, October 5, 2026, major U.S. index benchmarks showed mixed performance. The S&P 500 rose 33.00 points, or 0.43%, to 7,755.72, while the Nasdaq composite added 197.06 points, or 0.72%, to reach 27,387.93. Conversely, the Dow Jones Industrial Average fell 85.04 points, or 0.17%, closing at 51,091.92. The Russell 2000 index inched higher by 4.79 points, or 0.17%, to 2,837.69. Meanwhile, the 10-year Treasury yield ticked up 0.02 points, or 0.40%, to 5.30, and the VIX volatility index climbed 0.34 points, or 2.22%, to 15.65.
### Why This Lane Matters Divergence across major U.S. index benchmarks highlights shifting sector participation and interest rate sensitivity. Market participants watch how benchmark indices react to shifting Treasury yields and cross-asset volatility to gauge overall risk appetite.
### Money Play As broader index levels shift alongside benchmark Treasury yields, market participants track cross-asset indicators and sector rotation dynamics without relying on single-name catalysts.
### Related Names - VST - NU - MELI
Read the full story
Original reporting and related coverage — attribution links only, not paid recommendations.
Trade this story
 Robinhood
 Webull
 Tradier
 IBKR
IBKR
Chart this story
 TradingView
Broker and exchange buttons use invite / refer-a-friend links (rewards may be capped). Charting links (TradingView) are partner offers that may pay OppHub America a commission at no extra cost to you.
OppSHOP
Full OppSHOP →As an Amazon Associate, OppHub America earns from qualifying purchases. Shopping here helps keep the site free — at no extra cost to you. Disclosure

OppSHOP
Related to this story
As broader index levels shift alongside benchmark Treasury yields, marke
Shop related →

Investing books
Read the classics
Shop this pick →

Personal finance books
Run the household books
Shop this pick →

Trading notebooks
Write the thesis first
Shop this pick →

Monitor for charts
See every pane
Shop this pick →
Based on reporting from yahoo-tickers-tape-movers.
Informational and educational only — not investment, financial, or legal advice. Disclosure
Shares a vertical MP4 loop to your phone's camera roll or app share sheet (Instagram, TikTok, Facebook Reels).