OppHub America Desk · · Source: yahoo-megacap-tickers
Vanguard S&P 500 ETF (VOO) Performance Review: 322% Return Over 10 Years
If long-term broad market exposure and a low-cost structure are investment priorities, watch a vehicle such as the Vanguard S&P 500 . For investors seeking direct exposure to the fund's top tech holdings, monitoring , , and could offer more concentrated opportunities.
Based on reporting from yahoo-megacap-tickers.
The Vanguard S&P 500 ETF (VOO) has demonstrated significant long-term growth, delivering a 322% total return over the past decade. This performance underscores the potential for consistent capital appreciation through broad market exposure, despite a low expense ratio of just 0.03%. The fund's heavy allocation to technology stocks, including Nvidia, Apple, and Microsoft, has been a primary driver of its exceptional returns.
Market context for this story
As of: WeekendLoading quotes…
Informational only — not investment advice. Full markets →


$VOOVanguard S&P 500 ETF
TradingView
Live chart & market data via TradingView · OppHub classroom · Delayed or exchange real-time per TradingView data agreements · Not investment advice
$SPYSPDR S&P 500 ETF
TradingView
Live chart & market data via TradingView · OppHub classroom · Delayed or exchange real-time per TradingView data agreements · Not investment advice
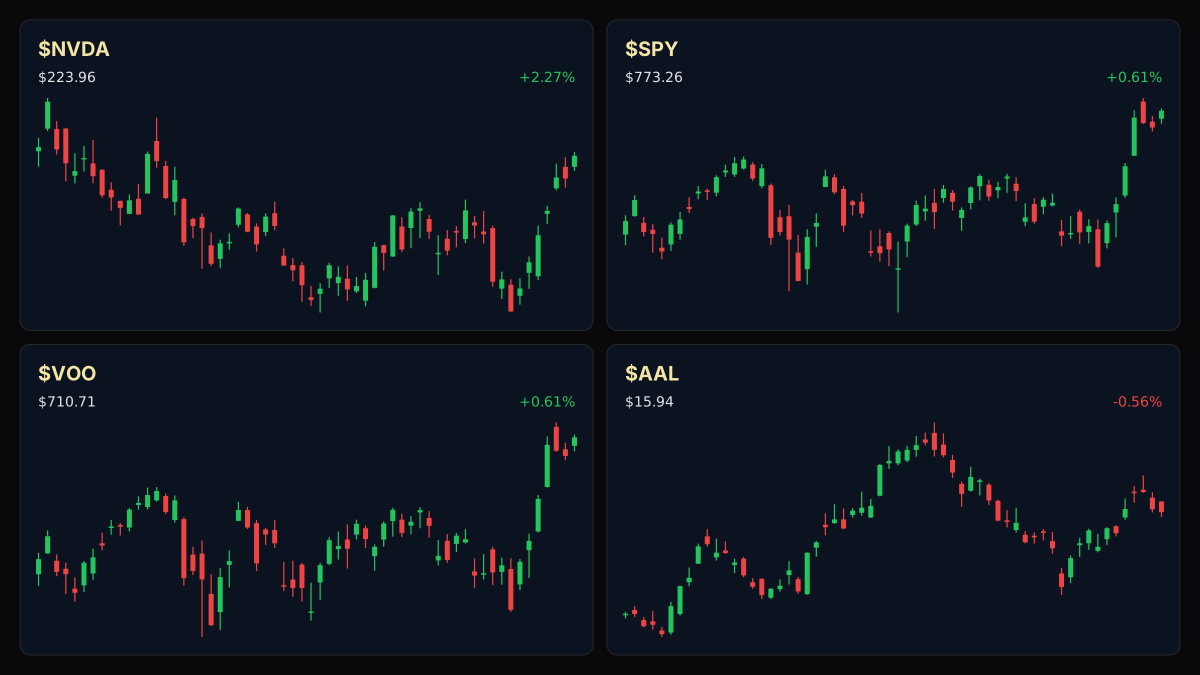
Educational TradingView charts — search any symbol in the widget. Confirm on /markets/VOO and related $SPY, $AAL, $NVDA. Not investment advice.
Related markets
Shares a vertical MP4 loop to your phone's camera roll or app share sheet (Instagram, TikTok, Facebook Reels).
The Vanguard S&P 500 ETF (VOO) has returned 322% over the last decade as of August 5, translating to an impressive annualized return of 15.4%, significantly above its historical 10% average. This performance highlights the efficacy of a diversified, low-cost approach to index investing.
The ETF's robust performance is substantially attributed to its significant exposure to the technology sector, which constitutes 38% of its holdings. Key constituents such as Nvidia (NVDA), Apple (AAPL), and Microsoft (MSFT) represent 7.51%, 6.59%, and 4.30% of the ETF, respectively. VOO currently holds $1.7 trillion in assets under management (AUM) and has a dividend yield of 1.03%. The fund's ultra-low expense ratio of 0.03% ensures that investors retain a larger portion of their investment gains.
### Money Play If long-term broad market exposure and a low-cost structure are investment priorities, watch a vehicle such as the Vanguard S&P 500 ETF. For investors seeking direct exposure to the fund's top tech holdings, monitoring $NVDA+WL, $AAPL+WL, and $MSFT+WL could offer more concentrated opportunities.
### Tape / Session Read Not applicable for a weekend session; performance metrics are historical.
### Why This Lane Matters The sustained performance of core U.S. market ETFs like VOO demonstrates the enduring power of systematic, diversified investing for capital accumulation. Its heavy tech weighting reflects current market leadership, illustrating how sector trends can drive overall index returns and shape investor portfolios.
### Related Names (optional) Not applicable; related names not directly cited as catalysts.
## S&P 500 ETF Technical Analysis & Key Risk Watch — LIVE MARKET CONTEXT for the lane ETF only
Read the full story
Original reporting and related coverage — attribution links only, not paid recommendations.
Trade this story
 Robinhood
 Webull
 Tradier
 IBKR
IBKR
Chart this story
 TradingView
Broker and exchange buttons use invite / refer-a-friend links (rewards may be capped). Charting links (TradingView) are partner offers that may pay OppHub America a commission at no extra cost to you.
OppSHOP
Full OppSHOP →As an Amazon Associate, OppHub America earns from qualifying purchases. Shopping here helps keep the site free — at no extra cost to you. Disclosure

OppSHOP
Related to this story
If long-term broad market exposure and a low-cost structure are investme
Shop related →

Investing books
Read the classics
Shop this pick →

Personal finance books
Run the household books
Shop this pick →

Trading notebooks
Write the thesis first
Shop this pick →

Monitor for charts
See every pane
Shop this pick →
Based on reporting from yahoo-megacap-tickers.
Informational and educational only — not investment, financial, or legal advice. Disclosure
Shares a vertical MP4 loop to your phone's camera roll or app share sheet (Instagram, TikTok, Facebook Reels).