OppHub America Desk · · Source: yahoo-tickers-tape-movers
Vanguard U.S. Momentum Factor ETF Shows Strong Historical Returns
* If historical momentum strategies can maintain performance, investors may consider ETFs like to capture potential outperformance. However, it's important to note that the stock market has historically averaged returns closer to 10% over long periods, and momentum stock performance is not guaranteed.
Based on reporting from yahoo-tickers-tape-movers.
Investors considering the Vanguard U.S. Momentum Factor ETF (VFMO) can look to historical performance for potential insights. The fund has outperformed both the Russell 3000 and the S&P 500 over various periods, showcasing its momentum-driven strategy.
Market context for this story
As of: WeekendLoading quotes…
Informational only — not investment advice. Full markets →


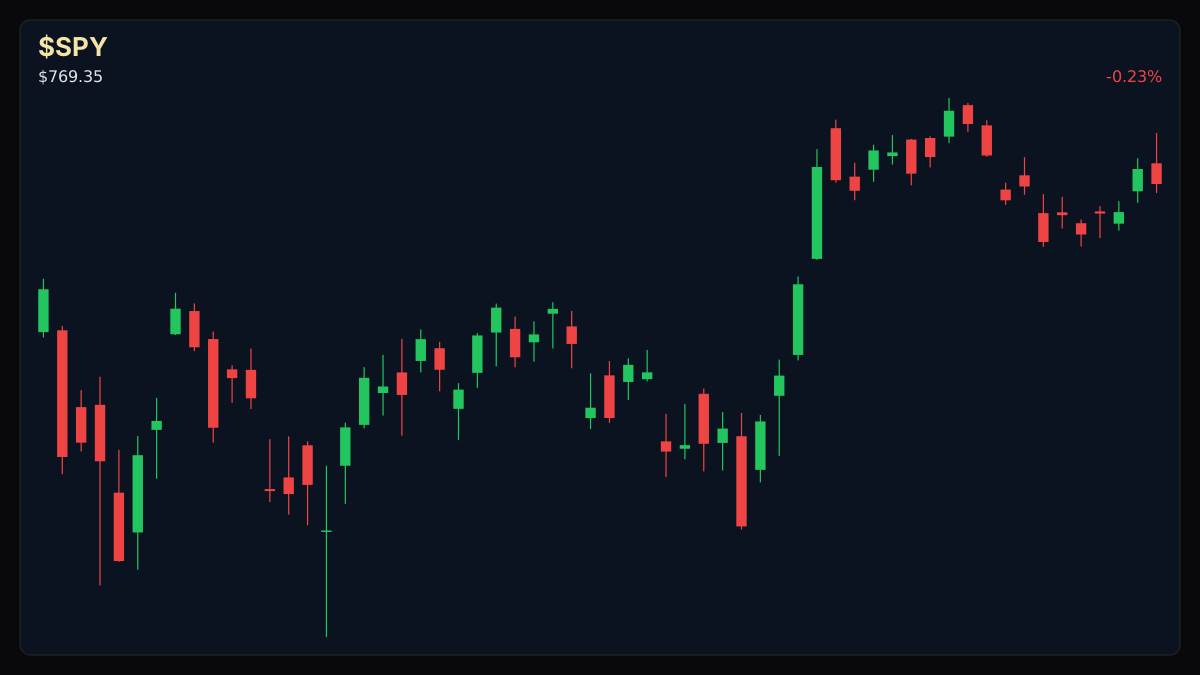
$SPYSPDR S&P 500 ETF
TradingView
Live chart & market data via TradingView · OppHub classroom · Delayed or exchange real-time per TradingView data agreements · Not investment advice
Educational TradingView chart — search any symbol in the widget. Confirm on /markets/SPY and related $AMAT, $MU. Not investment advice.
Related markets
Shares a vertical MP4 loop to your phone's camera roll or app share sheet (Instagram, TikTok, Facebook Reels).
The Vanguard U.S. Momentum Factor ETF (VFMO), with Assets Under Management of $1.8 billion and a dividend yield of 0.62%, employs a strategy focused on U.S. stocks exhibiting strong recent price movements. The ETF holds nearly 700 stocks and features a 100% turnover rate.
Historical performance data as of July 31, 2026, indicates the VFMO returned 28.85% in the past year, 22.30% over three years, and 12.83% over five years. These figures compare favorably to the Russell 3000, which returned 19.60%, 18.76%, and 11.82% for the same periods, and the S&P 500, which returned 19.56%, 19.32%, and 12.86% respectively. While past performance is not indicative of future results, the ETF's historical outperformance offers a data point for investors considering its momentum-based approach. The expense ratio for the ETF is 0.13%. Top holdings include KLAC at 1.24%, AMAT at 1.22%, and MU at 1.22%.
Read the full story
Original reporting and related coverage — attribution links only, not paid recommendations.
Trade this story
 Robinhood
 Webull
 Tradier
 IBKR
IBKR
Chart this story
 TradingView
Broker and exchange buttons use invite / refer-a-friend links (rewards may be capped). Charting links (TradingView) are partner offers that may pay OppHub America a commission at no extra cost to you.
OppSHOP
Full OppSHOP →As an Amazon Associate, OppHub America earns from qualifying purchases. Shopping here helps keep the site free — at no extra cost to you. Disclosure

OppSHOP
Related to this story
* If historical momentum strategies can maintain performance, investors
Shop related →

Investing books
Read the classics
Shop this pick →

Personal finance books
Run the household books
Shop this pick →

Trading notebooks
Write the thesis first
Shop this pick →

Monitor for charts
See every pane
Shop this pick →
Based on reporting from yahoo-tickers-tape-movers.
Informational and educational only — not investment, financial, or legal advice. Disclosure
Shares a vertical MP4 loop to your phone's camera roll or app share sheet (Instagram, TikTok, Facebook Reels).