Barry, OppHub America Desk · · Source: yahoo-tickers-tape-movers
Visa Card Network Credit Risk and Valuation Mechanics
If Visa ($V+WL) maintains processing volume dominance without credit loss exposure, watch payments infrastructure multiples against historical compounding baselines. Housing & mortgages: Rate and housing policy spill into builders, small-caps, and REITs.
Based on reporting from yahoo-tickers-tape-movers.
Visa card network operations diverge from traditional lending models as markets evaluate structural credit risk exposure. Investors examine how processing volumes and operating margins influence long-term compounding across payments leaders.
Market context for this story
As of: WeekendLoading quotes…
Informational only — not investment advice. Full markets →
 If Visa·$V
$VIf Visa
TradingView
Live chart & market data via TradingView · OppHub classroom · Delayed or exchange real-time per TradingView data agreements · Not investment advice
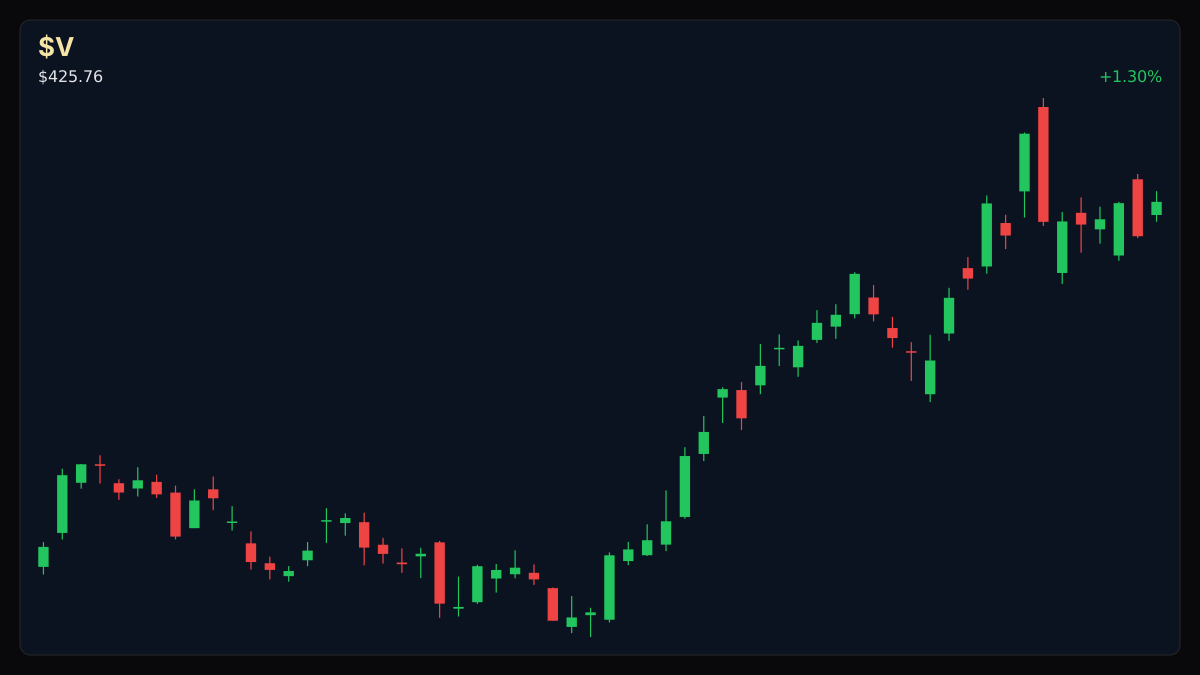
Educational TradingView chart — search any symbol in the widget. Confirm on /markets/V. Not investment advice.
Related markets
Shares a vertical MP4 loop to your phone's camera roll or app share sheet (Instagram, TikTok, Facebook Reels).
### Money Play - If Visa ($V+WL) maintains processing volume dominance without credit loss exposure, watch payments infrastructure multiples against historical compounding baselines. - Housing & mortgages: Rate and housing policy spill into builders, small-caps, and REITs.
### Session Tape - Visa ($V+WL): Evaluation of network fee dynamics and balance sheet mechanics.
## Catalyst Analysis: Network Architecture vs. Lending Models Card networks operate primarily as transaction facilitators rather than direct lenders, shielding payment processors from consumer credit defaults. Market participants analyze operating margins and fee structures to distinguish traditional lenders from transaction-fee networks.
### Story Arc / How We Got Here Building on prior coverage of Visa's long-term compounding trajectory at Visa Earnings Per Share Compounding and Growth Outlook, current market discussions focus on valuation resilience and structural distinctions between payment networks and consumer credit issuers.
## $V+WL Technical Analysis & Key Risk Watch
Volume patterns and historical growth projections guide portfolio allocations across the payments sector as market participants weigh valuation multiples against projected annualized growth rates.
### Story Arc / How We Got Here
This follows our earlier coverage ([Visa Earnings Per Share Compounding and Growth Outlook](/explore/visa-earnings-per-share-compounding-and-growth-outlook)) on 2026-11-06. Visa (NYSE: V) has compounded its earnings per share at an annualized rate of 17.4% over the past decade, fueling a 459% total return. Investors are examining whether the payments giant can sustain its historical growth trajectory despite broader market volatility. · Monitor Visa ($V+WL) valuation multiples against projected annualized growth of 13.7% over the next three fiscal years.
Read the full story
Original reporting and related coverage — attribution links only, not paid recommendations.
Trade this story
 Robinhood
 Webull
 Tradier
 IBKR
Chart this story
 TradingView
Broker and exchange buttons use invite / refer-a-friend links (rewards may be capped). Charting links (TradingView) are partner offers that may pay OppHub America a commission at no extra cost to you.
OppSHOP
Full OppSHOP →As an Amazon Associate, OppHub America earns from qualifying purchases. Shopping here helps keep the site free — at no extra cost to you. Disclosure

OppSHOP
Related to this story
If Visa ($V) maintains processing volume dominance without credit loss e
Shop related →

Investing books
Read the classics
Shop this pick →

Personal finance books
Run the household books
Shop this pick →

Trading notebooks
Write the thesis first
Shop this pick →

Monitor for charts
See every pane
Shop this pick →
Story playbook
A pre-built map of what to watch — stocks, ETFs, and educational next steps. Not personalized advice.
Snapshot date: November 14, 2026 at 10:15 AM ET
This playbook was built when the story published and is not live-updated. Prices, news, and risk can change after this date — treat it as a starting map, not a current trade ticket.
Story → money map
Payment Networks vs Lending Models
Visa makes money by moving money around, not by lending it out, which protects it when consumers struggle to pay debts. People who invest money are looking closely at how much Visa charges and whether its stock price makes sense right now.
What changed
Market participants are re-examining the valuation multiples of payment networks versus traditional lenders based on credit risk exposure.
Who wins / who loses
Payment processors like Visa benefit from transaction volume without credit losses, while traditional lenders face direct consumer default pressures.
Time horizon
Think in terms of the next few months.
Confidence & best fit
medium confidence · Long-term investor
Safer theme exposure (ETFs)
Baskets that own the theme without betting on one company.
Single stocks (higher risk)
Primary = closest to the story · Peers = same industry · Second-order = knock-on effects · Avoid = looks related but may be a trap
Primary
- $VWatch — track, don’t rush
Visa makes money on every swipe without taking on the risk of people not paying their credit cards back.
View $V chart → · End-of-day delayed data
Peer
- $MAWatch — track, don’t rush
Mastercard does the same kind of business and moves similarly based on how much people spend.
View $MA chart → · End-of-day delayed data
Second-order
- $XHBWatch — track, don’t rush
Housing and interest rate rules also impact homebuilders mentioned in broader market commentary.
View $XHB chart → · End-of-day delayed data
Avoid / trap
- $DFSStay away — for now
Lenders take on the risk of unpaid customer debt, unlike pure transaction networks.
Options (education only)
No strikes or expiries — a framework for how traders might express the view. Options can expire worthless.
Beginners should stick to watching the stock or using broad funds rather than trying to trade options here.
See options-friendly brokers →Income / OppHub America angle
Not a trade tip — ways to use the insight outside the market.
- Monitor broader consumer spending data and retail sales reports for clues on network transaction volumes.
What would break this thesis
- A sharp decline in global transaction processing volumes or unexpected regulatory fee caps.
- Macroeconomic shocks severely impacting consumer spending capacity.
What to do next on OppHub America
Saved playbooks stay on this device for now.
Important
Not financial advice. OppHub America playbooks are educational market maps only — not recommendations to buy, sell, or hold any security. Markets move fast; information can be wrong or outdated. Trade and invest at your own risk. Do your own research or consult a licensed advisor.
Based on reporting from yahoo-tickers-tape-movers.
Informational and educational only — not investment, financial, or legal advice. Disclosure
Shares a vertical MP4 loop to your phone's camera roll or app share sheet (Instagram, TikTok, Facebook Reels).