Barry, OppHub America Desk · · Source: yahoo-tickers-tape-movers
Visa Client Rebates and Fiscal 2027 Earnings Outlook
If Visa ($V+WL) sustains projected fiscal 2027 adjusted of approximately $15.00 and 13% expected revenue growth, watch $V+WL for valuation normalization against historical historical multiples.
Based on reporting from yahoo-tickers-tape-movers.
Visa Inc. (NYSE:V) generated $3.8 billion in value-added services revenue during fiscal Q3 2026 while managing a 17% increase in non-GAAP operating expenses that outpaced 14% net-revenue growth. Investors are evaluating whether higher client rebates and litigation charges impact the company's valuation as analysts project fiscal 2027 adjusted EPS around $15.00.
Market context for this story
As of: WeekendLoading quotes…
Informational only — not investment advice. Full markets →


$XLYConsumer Discretionary
TradingView
Live chart & market data via TradingView · OppHub classroom · Delayed or exchange real-time per TradingView data agreements · Not investment advice
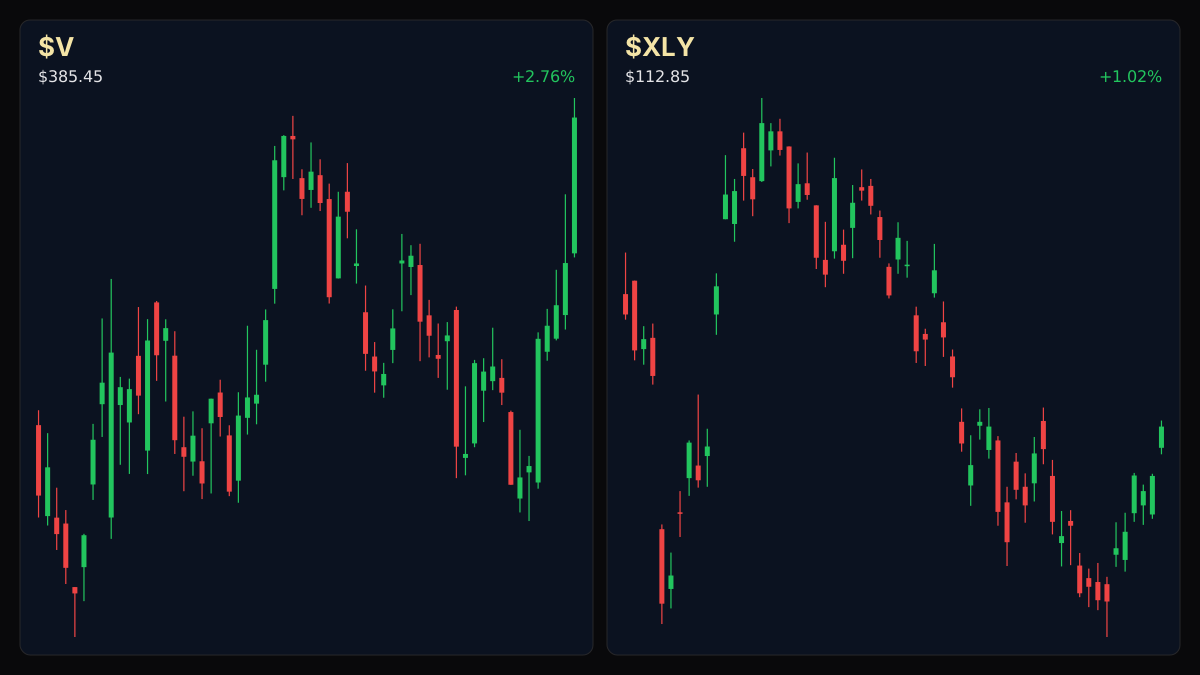
Educational TradingView chart — search any symbol in the widget. Confirm on /markets/XLY and related $V. Not investment advice.
Related markets
Shares a vertical MP4 loop to your phone's camera roll or app share sheet (Instagram, TikTok, Facebook Reels).
Visa Inc. (NYSE:V) reported fiscal Q3 2026 processed transactions increased 10% and cross-border volume excluding transactions within Europe grew 12% in constant dollars, while value-added services contributed $3.8 billion to top-line figures.
### Money Play - If Visa (NYSE:V) maintains its projected fiscal 2027 adjusted EPS of approximately $15.00 alongside 13% expected revenue growth, watch $V+WL for multiple alignment relative to historical valuations around 26x to 27x.
### Tape / Session Read During fiscal Q3 2026, Visa posted reported EPS of $2.97 compared to non-GAAP adjusted EPS of $3.32, with a $563 million severance charge and certain litigation provisions driving the variance. Non-GAAP operating expenses grew 17%, exceeding the 14% net-revenue growth rate.
### Why This Lane Matters Payment network volume and cross-border metrics serve as broader indicators of consumer discretionary spending and transactional velocity across global markets. Traders monitor processing growth and operating expense efficiency to gauge payment sector margins.
## Visa ($V+WL) Technical Analysis & Key Risk Watch — Weekend Tape Review
Traders tracking Visa (NYSE:V) focus on whether operating expense growth and client rebate structures pressure margins as analysts anticipate fiscal 2027 adjusted EPS of $15.00 versus $13.23 for fiscal 2026.
Read the full story
Original reporting and related coverage — attribution links only, not paid recommendations.
Trade this story (crypto)
 Coinbase
 Gemini
 Robinhood
 Webull
Chart this story
 TradingView
Broker and exchange buttons use invite / refer-a-friend links (rewards may be capped). Charting links (TradingView) are partner offers that may pay OppHub America a commission at no extra cost to you.
OppSHOP
Full OppSHOP →As an Amazon Associate, OppHub America earns from qualifying purchases. Shopping here helps keep the site free — at no extra cost to you. Disclosure

OppSHOP
Related to this story
If Visa ($V) sustains projected fiscal 2027 adjusted of approximately $1
Shop related →

Investing books
Read the classics
Shop this pick →

Personal finance books
Run the household books
Shop this pick →

Trading notebooks
Write the thesis first
Shop this pick →

Monitor for charts
See every pane
Shop this pick →
Story playbook
A pre-built map of what to watch — stocks, ETFs, and educational next steps. Not personalized advice.
Snapshot date: October 11, 2026 at 3:31 PM ET
This playbook was built when the story published and is not live-updated. Prices, news, and risk can change after this date — treat it as a starting map, not a current trade ticket.
Story → money map
payment network margins
Visa reported strong business numbers but also higher expenses and client payouts. Money experts are watching to see if future earnings growth will make the current stock price a fair deal.
What changed
Visa posted fiscal Q3 2026 results highlighting strong transaction volumes alongside higher non-GAAP operating expenses and client rebates.
Who wins / who loses
Payment network operators benefit from steady cross-border volume growth, while firms struggling with rising expense ratios or litigation charges face margin pressure.
Time horizon
Think in terms of the next few months.
Confidence & best fit
medium confidence · Long-term investor
Safer theme exposure (ETFs)
Baskets that own the theme without betting on one company.
Single stocks (higher risk)
Primary = closest to the story · Peers = same industry · Second-order = knock-on effects · Avoid = looks related but may be a trap
Primary
- $VWatch — track, don’t rush
We are keeping an eye on Visa shares to see if expected profit growth makes the stock price attractive.
View $V chart → · End-of-day delayed data
Peer
- $MAWatch — track, don’t rush
Mastercard is a close competitor that usually moves in the same direction based on consumer spending habits.
View $MA chart → · End-of-day delayed data
- $AXPWatch — track, don’t rush
American Express gives us another way to check if people are spending money freely on travel and shopping.
View $AXP chart → · End-of-day delayed data
Second-order
- $PYPLStay away — for now
PayPal represents online checkout trends, though it faces different competitive pressures than traditional card networks.
View $PYPL chart → · End-of-day delayed data
Options (education only)
No strikes or expiries — a framework for how traders might express the view. Options can expire worthless.
Beginners should skip options here and stick to watching the stock price relative to its long-term profit forecasts.
See options-friendly brokers →Income / OppHub America angle
Not a trade tip — ways to use the insight outside the market.
- Track broader consumer discretionary spending indicators and travel metrics to gauge future transaction volume.
What would break this thesis
- Operating expenses continuing to outpace net-revenue growth significantly longer than anticipated.
- Macroeconomic slowdown sharply depressing cross-border transaction volumes.
What to do next on OppHub America
Saved playbooks stay on this device for now.
Important
Not financial advice. OppHub America playbooks are educational market maps only — not recommendations to buy, sell, or hold any security. Markets move fast; information can be wrong or outdated. Trade and invest at your own risk. Do your own research or consult a licensed advisor.
Aftermath · $NVDA
-4.03% vs write
- •Since this piece: $NVDA is down -4.03% vs $238.90 at write time (now $229.28).
- •Session move (Yahoo delayed): -0.52%.
- •RSI14 at write was 84.6 — compare levels on Markets, not advice.
- •Original money play lens: If Visa ($V) sustains projected fiscal 2027 adjusted of approximately $15.00 and 13% expected revenue growth, watch $V for valuation normalization against historical historical mul
- •Track $NVDA live on OppHub Markets (/markets/NVDA). Not financial advice.
Based on reporting from yahoo-tickers-tape-movers.
Informational and educational only — not investment, financial, or legal advice. Disclosure
Shares a vertical MP4 loop to your phone's camera roll or app share sheet (Instagram, TikTok, Facebook Reels).