Barry, OppHub America Desk · · Source: yahoo-megacap-tickers
VOO Outperformance vs. VTI Set to Shift Amid Broader Market Trends
If the market broadens beyond mega-cap technology, investors holding may find offering a more diversified growth profile. For those seeking exposure to innovation without the higher expense ratios of actively managed funds like Cathie Wood's Innovation (0.75%), comparing the slightly different weightings of and in high-growth names such as , , and is crucial.
Based on reporting from yahoo-megacap-tickers.
The Vanguard S&P 500 ETF ($VOO+WL) is projected to cede its four-year outperformance against the Vanguard Total Stock Market ETF ($VTI+WL), signaling a potential shift in market leadership. This anticipated change comes as smaller-cap stocks gain traction, impacting the concentration advantage $VOO+WL has held through its mega-cap technology exposure.
Market context for this story
As of: WeekendLoading quotes…
Informational only — not investment advice. Full markets →


$VOOVanguard S&P 500 ETF
TradingView
Live chart & market data via TradingView · OppHub classroom · Delayed or exchange real-time per TradingView data agreements · Not investment advice
$VTIVanguard Total Stock Market
TradingView
Live chart & market data via TradingView · OppHub classroom · Delayed or exchange real-time per TradingView data agreements · Not investment advice
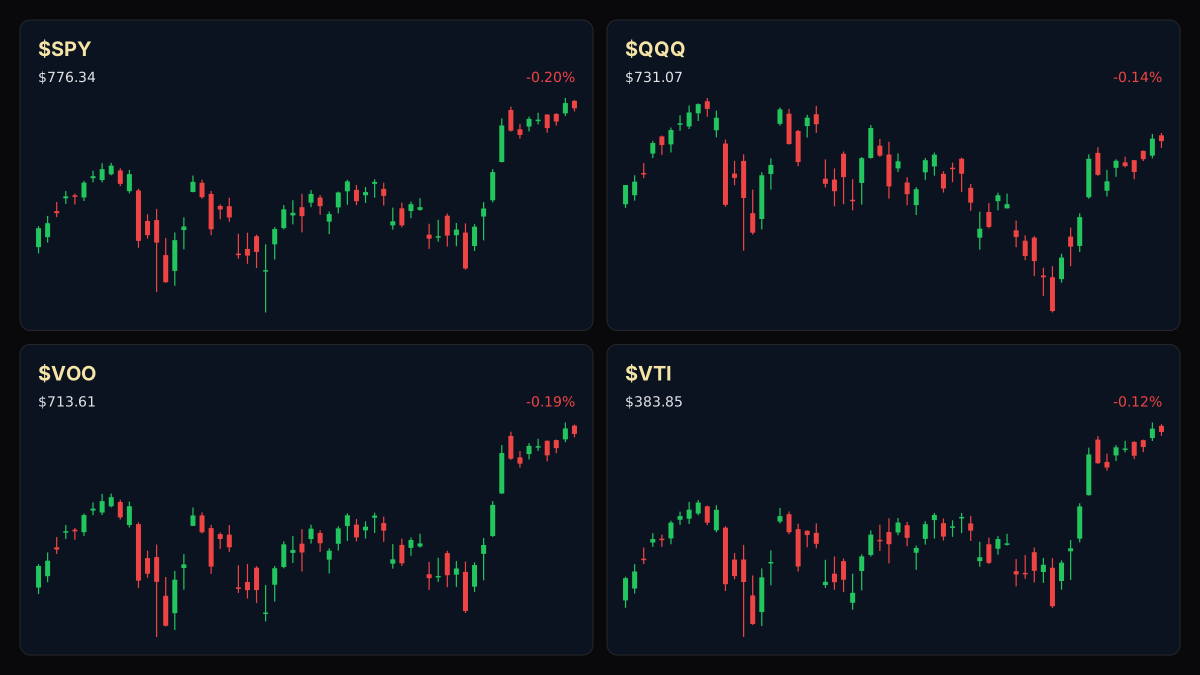
Educational TradingView charts — search any symbol in the widget. Confirm on /markets/VOO and related $VTI, $SPY, $QQQ. Not investment advice.
Related markets
Shares a vertical MP4 loop to your phone's camera roll or app share sheet (Instagram, TikTok, Facebook Reels).
The Vanguard S&P 500 ETF ($VOO+WL) is poised to lose its four-year streak of outperforming the Vanguard Morningstar Total Stock Market ETF ($VTI+WL), reflecting an evolving market dynamic. This shift marks a notable development for investors considering broad market exposure through low-cost exchange-traded funds.
### Story Arc / How We Got Here
Last week, on Sunday, August 9, 2026, OppHub reported on the Vanguard S&P 500 ETF's ($VOO+WL) remarkable 322% total return over the past decade, driven largely by its allocation to mega-cap technology stocks such as Nvidia ($NVDA+WL), Apple ($AAPL+WL), and Microsoft ($MSFT+WL). This concentration has been a key factor in its historical outperformance. Today's analysis suggests this trend may be reversing as broader market participation expands beyond these concentrated large-cap names. For further context, see our previous coverage on the Vanguard S&P 500 ETF at /explore/vanguard-sp-500-etf-voo-performance-review-322-percent-return-over-10-years.
### Tape / Session Read
Both the Vanguard S&P 500 ETF ($VOO+WL) and the Vanguard Morningstar Total Stock Market ETF ($VTI+WL) hold significant assets under management, at $1.7 trillion and $2.3 trillion respectively, and share an identical expense ratio of 0.03%. The S&P 500 comprises approximately 80% of the total U.S. stock market. However, $VOO+WL's concentrated exposure to mega-cap technology names has historically distinguished its performance. For example, $VOO+WL's weighting in Nvidia was 7.51% compared to $VTI+WL's 6.33%. Similarly, Apple accounted for 6.59% in $VOO+WL versus 5.85% in $VTI+WL, and Microsoft held a 4.30% weighting in $VOO+WL against 3.81% in $VTI+WL. Collectively, top technology names, including Nvidia, Apple, Microsoft, and others, comprised 37.9% of $VOO+WL, compared to 33.3% for $VTI+WL. This concentration has historically fueled $VOO+WL's outperformance, with $VOO+WL recording returns of 25.7%, 26.3%, 25%, and 17.8% from 2022 to 2025, compared to $VTI+WL's 28.8%, 26.1%, 23.8%, and 17.1% during the same years (Note: 2022 was negative for both, at (18.2%) for $VOO+WL and (19.5%) for $VTI+WL). For 2026 year-to-date, $VTI+WL has shown a slight edge at 14.6% against $VOO+WL's 13.9%, hinting at the projected shift.
### Why This Lane Matters
The anticipated divergence in performance between $VOO+WL and $VTI+WL indicates a potential shift in market leadership, moving away from concentrated mega-cap dominance towards broader market participation, including small- and mid-cap stocks. This trend could signal an alteration in investor risk appetite and sector rotation dynamics, affecting portfolio allocations seeking diversification beyond the largest companies.
### Related Names No additional related names are ## $VOO+WL Technical Analysis & Key Risk Watch — Weekend Session
While specific live price data for $VOO+WL is not provided, the broader market context shows notable movements among its top holdings. Nvidia ($NVDA+WL) ended the week at $217.55, down 2.86%, with its RSI14 at 57.5. Microsoft ($MSFT+WL) closed at $506.06, up 1.21%, with a high RSI14 of 84.5, potentially indicating an overbought condition. Apple ($AAPL+WL) saw a significant decline of 7.35% to $308.91, with an RSI14 of 45.1. The varying performance and RSI levels among these mega-cap components suggest potential volatility for equity portfolios heavily weighted in these names.
Read the full story
Original reporting and related coverage — attribution links only, not paid recommendations.
Trade this story
 Robinhood
 Webull
 Tradier
 IBKR
IBKR
Chart this story
 TradingView
Broker and exchange buttons use invite / refer-a-friend links (rewards may be capped). Charting links (TradingView) are partner offers that may pay OppHub America a commission at no extra cost to you.
OppSHOP
Full OppSHOP →As an Amazon Associate, OppHub America earns from qualifying purchases. Shopping here helps keep the site free — at no extra cost to you. Disclosure

OppSHOP
Related to this story
If the market broadens beyond mega-cap technology, investors holding may
Shop related →

Investing books
Read the classics
Shop this pick →

Personal finance books
Run the household books
Shop this pick →

Trading notebooks
Write the thesis first
Shop this pick →

Monitor for charts
See every pane
Shop this pick →
Story playbook
A pre-built map of what to watch — stocks, ETFs, and educational next steps. Not personalized advice.
Snapshot date: August 16, 2026 at 8:31 AM ET
This playbook was built when the story published and is not live-updated. Prices, news, and risk can change after this date — treat it as a starting map, not a current trade ticket.
Story → money map
Broad Market Rotation
The giant tech stocks that pushed the S&P 500 ahead of the overall stock market for years are slowing down compared to smaller companies. Investors are looking at broader funds because smaller stocks are starting to catch up.
What changed
Market breadth is expanding beyond mega-cap technology, threatening VOO's multi-year outperformance streak against total market index funds like VTI.
Who wins / who loses
Diversified index funds and small-cap indexes benefit from broadening participation, while ultra-concentrated mega-cap tech heavy portfolios face relative headwinds.
Time horizon
Think in terms of the next few months.
Confidence & best fit
medium confidence · Long-term investor
Safer theme exposure (ETFs)
Baskets that own the theme without betting on one company.
Single stocks (higher risk)
Primary = closest to the story · Peers = same industry · Second-order = knock-on effects · Avoid = looks related but may be a trap
Primary
- $VOOWatch — track, don’t rush
The S&P 500 fund might grow slower if giant tech stocks take a breather.
View $VOO chart → · End-of-day delayed data
Peer
- $VTIBuild slowly — only if it fits your plan
Buying the whole stock market captures smaller companies that are starting to outperform.
View $VTI chart → · End-of-day delayed data
Second-order
- $IWMBuild slowly — only if it fits your plan
Small company stocks benefit directly when investors look beyond big tech.
View $IWM chart → · End-of-day delayed data
Options (education only)
No strikes or expiries — a framework for how traders might express the view. Options can expire worthless.
Beginners should stick to buying and holding low-cost index funds rather than using options.
See options-friendly brokers →Income / OppHub America angle
Not a trade tip — ways to use the insight outside the market.
- Rebalance retirement accounts to ensure desired exposure between large-cap and total-market funds.
What would break this thesis
- Mega-cap tech earnings accelerate sharply, reasserting dominance and resuming VOO outperformance.
What to do next on OppHub America
Saved playbooks stay on this device for now.
Important
Not financial advice. OppHub America playbooks are educational market maps only — not recommendations to buy, sell, or hold any security. Markets move fast; information can be wrong or outdated. Trade and invest at your own risk. Do your own research or consult a licensed advisor.
Based on reporting from yahoo-megacap-tickers.
Informational and educational only — not investment, financial, or legal advice. Disclosure
Shares a vertical MP4 loop to your phone's camera roll or app share sheet (Instagram, TikTok, Facebook Reels).