Barry, OppHub America Desk · · Source: yahoo-tickers-tape-movers
Warren Buffett Farewell Letter Highlights Time in S&P 500
Long-term compounding strategies rely on index-level exposure and disciplined allocation rather than short-term tactical trading.
Based on reporting from yahoo-tickers-tape-movers.
Following sixty years at Berkshire Hathaway, Warren Buffett released a farewell letter on Sunday, September 18, 2026, emphasizing long-term S&P 500 compounding. Investors analyzing historical index performance and time-in-market strategies look to multi-decade growth metrics for wealth building.
Market context for this story
As of: WeekendLoading quotes…
Informational only — not investment advice. Full markets →


$SPYSPDR S&P 500 ETF
TradingView
Live chart & market data via TradingView · OppHub classroom · Delayed or exchange real-time per TradingView data agreements · Not investment advice
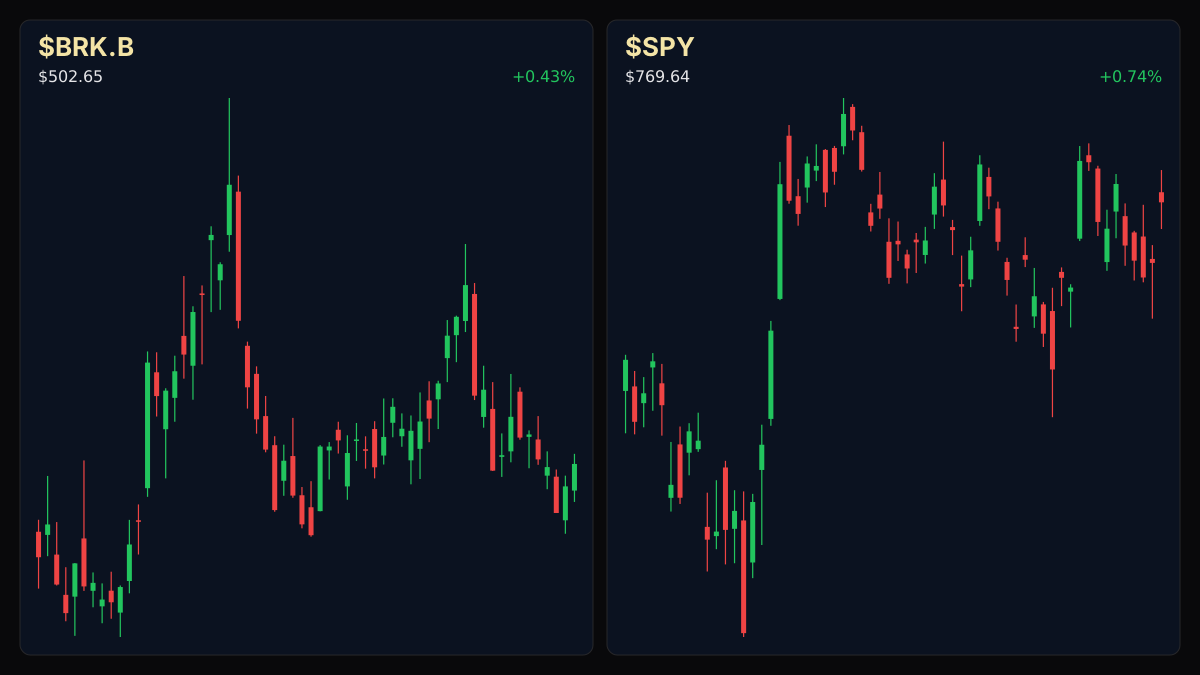
Educational TradingView chart — search any symbol in the widget. Confirm on /markets/SPY and related $BRK.B. Not investment advice.
Related markets
Shares a vertical MP4 loop to your phone's camera roll or app share sheet (Instagram, TikTok, Facebook Reels).
### Session Tape — Weekend Index & Historical Context - S&P 500 (^GSPC): Historical long-term upward trajectory with documented average annual returns of 11.5%.
## Catalyst Analysis: The Power of Time in Market In his final shareholder letter released on Friday, September 18, 2026, outgoing Berkshire Hathaway CEO and Chairman Warren Buffett encapsulated multi-decade compounding with four words: "Father Time always wins." Rather than focusing strictly on individual stock selection or market timing, the commentary stresses that time in the market drives primary portfolio expansion over multi-decade horizons.
Historical metrics cited in the source indicate that the S&P 500 has averaged an 11.5% annual return. Under historical simulation models assuming a $20,000 initial layout, balances scale to $59,400 after 10 years, reach $524,000 at 30 years—where 88% of the balance stems from investment gains—and exceed $1.5 million at 40 years, where 95% of the total reflects cumulative gains.
## Long-Term Capital Allocation & Risk Framework Additional data points highlight that the S&P 500 has outperformed 86% of actively managed large-cap funds over comparable multi-year periods. For market participants evaluating capital allocation, systematic dollar-cost averaging combined with extended holding horizons minimizes single-cycle timing risks.
### Money Play Long-term compounding strategies rely on index-level exposure and disciplined allocation rather than short-term tactical trading.
Read the full story
Original reporting and related coverage — attribution links only, not paid recommendations.
Trade this story
 Robinhood
 Webull
 Tradier
 IBKR
IBKR
Chart this story
 TradingView
Broker and exchange buttons use invite / refer-a-friend links (rewards may be capped). Charting links (TradingView) are partner offers that may pay OppHub America a commission at no extra cost to you.
OppSHOP
Full OppSHOP →As an Amazon Associate, OppHub America earns from qualifying purchases. Shopping here helps keep the site free — at no extra cost to you. Disclosure

OppSHOP
Related to this story
Long-term compounding strategies rely on index-level exposure and discip
Shop related →

Investing books
Read the classics
Shop this pick →

Personal finance books
Run the household books
Shop this pick →

Trading notebooks
Write the thesis first
Shop this pick →

Monitor for charts
See every pane
Shop this pick →
Story playbook
A pre-built map of what to watch — stocks, ETFs, and educational next steps. Not personalized advice.
Snapshot date: October 4, 2026 at 8:31 AM ET
This playbook was built when the story published and is not live-updated. Prices, news, and risk can change after this date — treat it as a starting map, not a current trade ticket.
Story → money map
long-term index compounding
Warren Buffett released a goodbye letter reminding investors that holding index funds for a long time beats trying to time the market. People who care about money should focus on steady, long-term saving rather than quick trades.
What changed
Warren Buffett published his final shareholder letter advocating for long-term index investing.
Who wins / who loses
Passive index funds and long-term buy-and-hold investors benefit, while high-fee active managers and short-term traders face structural headwinds.
Time horizon
Think in terms of the next few months.
Confidence & best fit
high confidence · Long-term investor
Safer theme exposure (ETFs)
Baskets that own the theme without betting on one company.
Single stocks (higher risk)
Primary = closest to the story · Peers = same industry · Second-order = knock-on effects · Avoid = looks related but may be a trap
Primary
- $BRK.BBuild slowly — only if it fits your plan
Warren Buffett's company represents the exact long-term holding style highlighted in the letter.
View $BRK.B chart → · End-of-day delayed data
Options (education only)
No strikes or expiries — a framework for how traders might express the view. Options can expire worthless.
Beginners should skip options entirely for this strategy and simply buy and hold shares over many years.
See options-friendly brokers →Income / OppHub America angle
Not a trade tip — ways to use the insight outside the market.
- Automatic weekly or monthly recurring contributions into a retirement brokerage account
What would break this thesis
- Structural regulatory changes to major exchange-traded funds or persistent multi-decade macroeconomic stagflation breaking historical equity returns.
What to do next on OppHub America
Saved playbooks stay on this device for now.
Important
Not financial advice. OppHub America playbooks are educational market maps only — not recommendations to buy, sell, or hold any security. Markets move fast; information can be wrong or outdated. Trade and invest at your own risk. Do your own research or consult a licensed advisor.
Based on reporting from yahoo-tickers-tape-movers.
Informational and educational only — not investment, financial, or legal advice. Disclosure
Shares a vertical MP4 loop to your phone's camera roll or app share sheet (Instagram, TikTok, Facebook Reels).