Barry, OppHub America Desk · · Source: yahoo-tickers-tape-movers
Weatherford International Surges 8% on Q3 Bottom-Line Beat
Market participants following energy sector equipment suppliers should watch fundamental margin progression and tax provision adjustments rather than relying solely on headline revenue prints.
Based on reporting from yahoo-tickers-tape-movers.
Weatherford International delivered a strong third-quarter earnings report after the market close on Tuesday, October 20, 2026, triggering a nearly 8% equity gain during the subsequent trading session. Despite a single-digit decline in total revenue to $1.14 billion, the oilfield equipment maker posted a 48% surge in GAAP net income to $120 million driven by reduced income tax provisions.
Market context for this story
As of: After HoursLoading quotes…
Informational only — not investment advice. Full markets →


$XLEEnergy Select Sector
TradingView
Live chart & market data via TradingView · OppHub classroom · Delayed or exchange real-time per TradingView data agreements · Not investment advice
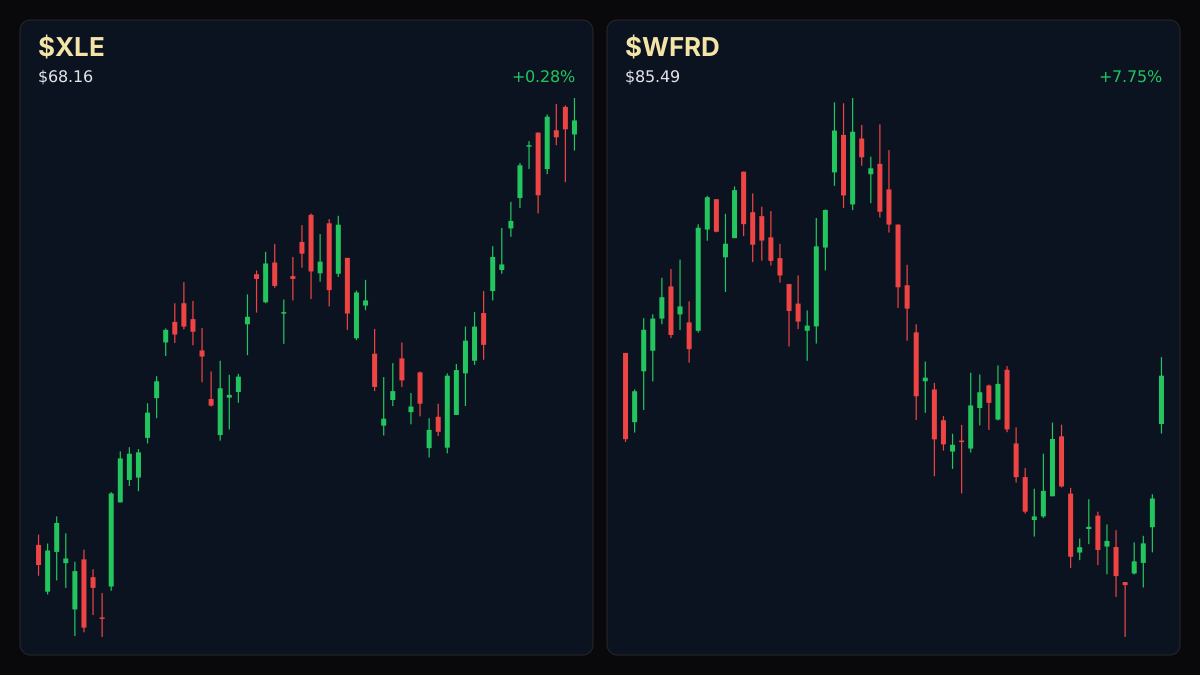
Educational TradingView chart — search any symbol in the widget. Confirm on /markets/XLE and related $WFRD. Not investment advice.
Related markets
Shares a vertical MP4 loop to your phone's camera roll or app share sheet (Instagram, TikTok, Facebook Reels).
### Session Tape — Weatherford International - **Weatherford International ($WFRD+WL):** +7.75% session advance following a Q3 bottom-line earnings beat.
## Catalyst Analysis: Q3 Earnings & Profitability Weatherford International reported its third-quarter financial results following the market close on Tuesday, October 20, 2026. Market participants bid the equipment maker higher by nearly 8% during the active session as net income climbed 48% year-over-year to $120 million, translating to $1.66 per share. Non-GAAP adjusted free cash flow expanded 57% to $155 million.
While total revenue slipped to $1.14 billion from $1.23 billion in the comparable period of 2025, and all three primary business units recorded single-digit percentage top-line declines, the significant reduction in income tax provisions cushioned the bottom line and propelled the double beat.
## Impact on Energy Sector Equities The earnings print underscores margin resilience and cash generation within oilfield services despite modest year-over-year revenue contractions across operational units. Traders continue to monitor capital efficiency metrics across broader energy and tech names, where valuation multiples depend heavily on free cash flow conversion rather than top-line expansion alone.
### Money Play - Market participants following energy sector equipment suppliers should watch fundamental margin progression and tax provision adjustments rather than relying solely on headline revenue prints.
Read the full story
Original reporting and related coverage — attribution links only, not paid recommendations.
Trade this story
 Robinhood
 Webull
 Tradier
 IBKR
Chart this story
 TradingView
Broker and exchange buttons use invite / refer-a-friend links (rewards may be capped). Charting links (TradingView) are partner offers that may pay OppHub America a commission at no extra cost to you.
OppSHOP
Full OppSHOP →As an Amazon Associate, OppHub America earns from qualifying purchases. Shopping here helps keep the site free — at no extra cost to you. Disclosure

OppSHOP
Related to this story
Market participants following energy sector equipment suppliers should w
Shop related →

Investing books
Read the classics
Shop this pick →

Personal finance books
Run the household books
Shop this pick →

Trading notebooks
Write the thesis first
Shop this pick →

Monitor for charts
See every pane
Shop this pick →
Story playbook
A pre-built map of what to watch — stocks, ETFs, and educational next steps. Not personalized advice.
Snapshot date: October 21, 2026 at 7:01 PM ET
This playbook was built when the story published and is not live-updated. Prices, news, and risk can change after this date — treat it as a starting map, not a current trade ticket.
Story → money map
oilfield services earnings
Weatherford made more profit even though it sold slightly less stuff, thanks to lower taxes and better cash management, making its stock jump. Beginners should know that strong profits and cash matter just as much as total sales.
What changed
Weatherford International reported a Q3 bottom-line earnings and free cash flow beat despite a modest revenue decline.
Who wins / who loses
Oilfield equipment providers with strong cash conversion win, while slower peers with lagging margins lose.
Time horizon
Think in terms of the next few weeks.
Confidence & best fit
medium confidence · Active trader
Safer theme exposure (ETFs)
Baskets that own the theme without betting on one company.
Single stocks (higher risk)
Primary = closest to the story · Peers = same industry · Second-order = knock-on effects · Avoid = looks related but may be a trap
Primary
- $WFRDWatch — track, don’t rush
The company whose earnings caused the stock price to jump.
View $WFRD chart → · End-of-day delayed data
Peer
- $SLBWatch — track, don’t rush
A major competitor in the oilfield services industry.
View $SLB chart → · End-of-day delayed data
- $HALWatch — track, don’t rush
Another large industry peer affected by energy spending trends.
View $HAL chart → · End-of-day delayed data
Options (education only)
No strikes or expiries — a framework for how traders might express the view. Options can expire worthless.
Beginners should skip options here and focus on understanding how earnings reports affect stock prices.
See options-friendly brokers →Income / OppHub America angle
Not a trade tip — ways to use the insight outside the market.
- Review local energy service supply chain contracts in oil-producing regions.
What would break this thesis
- Subsequent quarters show deterioration in free cash flow conversion or renewed top-line contraction.
What to do next on OppHub America
Saved playbooks stay on this device for now.
Important
Not financial advice. OppHub America playbooks are educational market maps only — not recommendations to buy, sell, or hold any security. Markets move fast; information can be wrong or outdated. Trade and invest at your own risk. Do your own research or consult a licensed advisor.
Based on reporting from yahoo-tickers-tape-movers.
Informational and educational only — not investment, financial, or legal advice. Disclosure
Shares a vertical MP4 loop to your phone's camera roll or app share sheet (Instagram, TikTok, Facebook Reels).