Barry, OppHub America Desk · · Source: yahoo-tickers-tape-movers
AI Chip Stocks Post October Sell-Off: November Valuations
Market participants tracking semiconductor equities should observe volume validation near established support bands rather than chasing short-term percentage shifts.
Based on reporting from yahoo-tickers-tape-movers.
Following an October market pullback that compressed artificial intelligence hardware valuations, investors are reassessing sector entries as broader indexes navigate late-year trading. Technology equities show varying technical momentum across major indices heading into Sunday, November 8, 2026.
Market context for this story
As of: WeekendLoading quotes…
Informational only — not investment advice. Full markets →


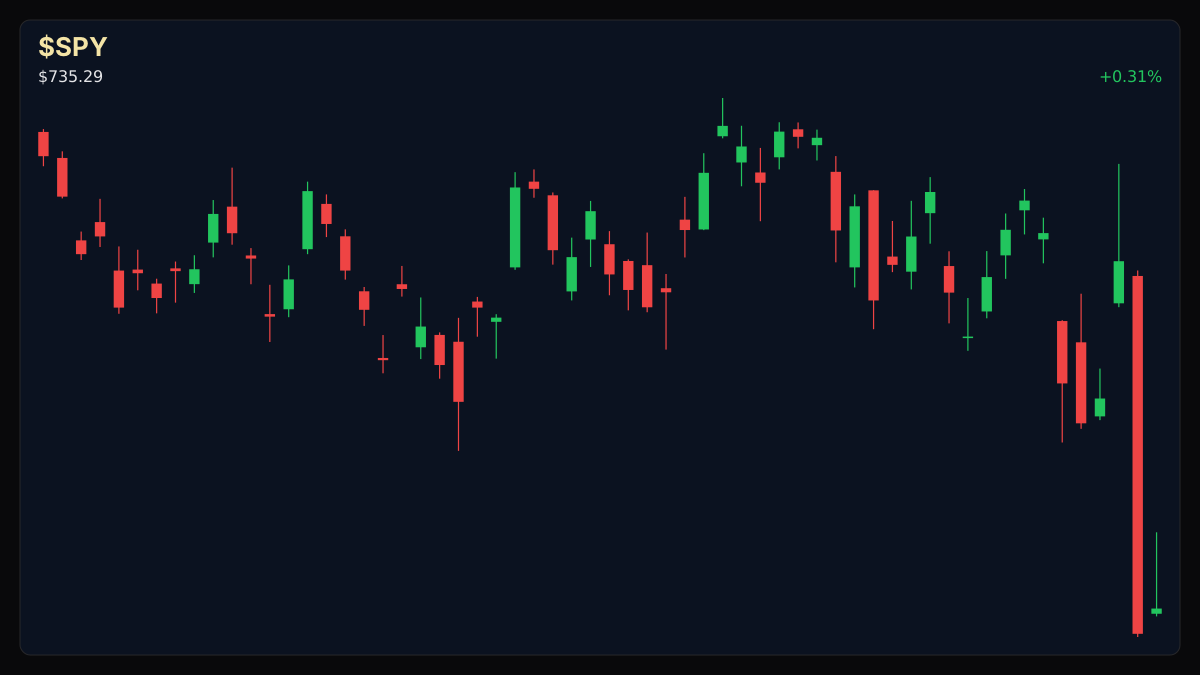
$SPYSPDR S&P 500 ETF
TradingView
Live chart & market data via TradingView · OppHub classroom · Delayed or exchange real-time per TradingView data agreements · Not investment advice
$AAPL
TradingView
Live chart & market data via TradingView · OppHub classroom · Delayed or exchange real-time per TradingView data agreements · Not investment advice
Educational TradingView charts — search any symbol in the widget. Confirm on /markets/SPY and related $AAPL, $NVDA, $MSFT. Not investment advice.
Related markets
Shares a vertical MP4 loop to your phone's camera roll or app share sheet (Instagram, TikTok, Facebook Reels).
### Session Tape — Sunday, November 8, 2026 - S&P 500: 7,376.86 (+0.3%) - DJI: 51,285.73 (-0.5%) - NASDAQ: 24,579.42 (+1.1%) - Bitcoin: $75,863.00 (-0.1%)
## Catalyst Analysis: Post-October Sector Rebalancing Broad technology indices and specialized semiconductor equities experienced notable volatility through October, setting up a recalibration of multiples as market participants evaluate forward growth trajectories and hardware demand cycles. While major benchmarks such as the S&P 500 and NASDAQ reflect mixed sentiment, individual semiconductor names have absorbed varying degrees of downward pressure, prompting closer technical inspection of oversold conditions.
## Technical Outlook & Key Risk Watch Market participants tracking large-cap technology components navigate shifting momentum indicators and moving averages. Key levels for NVDA (educational): R2 $213.85 · R1 $209.06 · last $202.06 · S1 $201.66 · S2 $200.92, with an RSI14 reading of 26.9 indicating oversold territory alongside relative volume at 1.17x its 20-day average. Meanwhile, key levels for MSFT (educational): R2 $512.19 · R1 $508.50 · last $507.12 · S1 $506.39 · S2 $502.27, showing an RSI14 of 27.8 and a 20-day volume multiple of 1.57x. Apple shares show key levels for AAPL (educational): R2 $351.73 · R1 $347.82 · last $347.73 · S1 $345.75 · S2 $340.74, accompanied by an extended RSI14 of 72.3 and volume at 1.04x normal levels.
## Impact on Technology Sector Sentiment Sector-wide price adjustments in high-growth computing suppliers influence broader index participation, particularly as institutional desks rebalance portfolios following multi-week retracements. Monitoring volume profiles relative to moving averages remains critical for identifying stabilization zones across semiconductor leaders.
Read the full story
Original reporting and related coverage — attribution links only, not paid recommendations.
Trade this story
 Robinhood
 Webull
 Tradier
 IBKR
Chart this story
 TradingView
Broker and exchange buttons use invite / refer-a-friend links (rewards may be capped). Charting links (TradingView) are partner offers that may pay OppHub America a commission at no extra cost to you.
OppSHOP
Full OppSHOP →As an Amazon Associate, OppHub America earns from qualifying purchases. Shopping here helps keep the site free — at no extra cost to you. Disclosure

OppSHOP
Related to this story
Market participants tracking semiconductor equities should observe volum
Shop related →

Investing books
Read the classics
Shop this pick →

Personal finance books
Run the household books
Shop this pick →

Trading notebooks
Write the thesis first
Shop this pick →

Monitor for charts
See every pane
Shop this pick →
Story playbook
A pre-built map of what to watch — stocks, ETFs, and educational next steps. Not personalized advice.
Snapshot date: November 8, 2026 at 7:01 AM ET
This playbook was built when the story published and is not live-updated. Prices, news, and risk can change after this date — treat it as a starting map, not a current trade ticket.
Story → money map
AI hardware valuation reset
Big technology and computer chip companies saw their stock prices drop in October, making them cheaper to buy today. Investors are watching closely to see if prices stabilize before jumping back in.
What changed
October market volatility compressed valuations across AI hardware and mega-cap technology equities.
Who wins / who loses
Patient investors waiting for discounted entry points benefit, while momentum chasers face near-term volatility risks.
Time horizon
Think in terms of the next few weeks.
Confidence & best fit
medium confidence · Long-term investor, Active trader
Safer theme exposure (ETFs)
Baskets that own the theme without betting on one company.
Single stocks (higher risk)
Primary = closest to the story · Peers = same industry · Second-order = knock-on effects · Avoid = looks related but may be a trap
Primary
- $NVDAWatch — track, don’t rush
The leading AI chip maker saw its stock drop to a level where buyers usually step in, so people are watching to see if it bounces.
View $NVDA chart → · End-of-day delayed data
- $MSFTWatch — track, don’t rush
Large investors are trading heavy volumes near support lines, signaling potential stabilization.
View $MSFT chart → · End-of-day delayed data
Peer
- $AAPLProtect — reduce risk
Unlike its peers, this stock ran up too fast and might pull back, making it a good candidate for caution.
View $AAPL chart → · End-of-day delayed data
Options (education only)
No strikes or expiries — a framework for how traders might express the view. Options can expire worthless.
Direction: bullish · Style: Debit spread (defined risk) · Level: intermediate
Beginners should skip options here due to high volatility; stick to buying shares or ETFs if you want to participate.
Income / OppHub America angle
Not a trade tip — ways to use the insight outside the market.
- Review personal portfolio allocation to ensure technology exposure aligns with long-term risk tolerance.
What would break this thesis
- Breakdown below major support bands with expanding volume indicating capitulation.
What to do next on OppHub America
Saved playbooks stay on this device for now.
Important
Not financial advice. OppHub America playbooks are educational market maps only — not recommendations to buy, sell, or hold any security. Markets move fast; information can be wrong or outdated. Trade and invest at your own risk. Do your own research or consult a licensed advisor.
Based on reporting from yahoo-tickers-tape-movers.
Informational and educational only — not investment, financial, or legal advice. Disclosure
Shares a vertical MP4 loop to your phone's camera roll or app share sheet (Instagram, TikTok, Facebook Reels).