Barry, OppHub America Desk · · Source: yahoo-megacap-tickers
Alphabet's Depreciation Threat: Elevated 2027 Cost Projections
Investors should monitor Alphabet's ongoing capital expenditure trends and future depreciation schedules, which are expected to place pressure on earnings beginning in 2027.
Based on reporting from yahoo-megacap-tickers.
Alphabet's aggressive capital expenditures in 2026, projected to reach $205 billion, indicate significant future depreciation charges, with the heaviest impact expected to begin in 2027. This financial structure suggests sustained pressure on the company's profit and loss statement for U.S. investors following its second-quarter report.
Market context for this story
As of: PremarketLoading quotes…
Informational only — not investment advice. Full markets →
 $GOOGL
$GOOGL
TradingView
Live chart & market data via TradingView · OppHub classroom · Delayed or exchange real-time per TradingView data agreements · Not investment advice
Educational TradingView chart — search any symbol in the widget. Confirm on /markets/GOOGL. Not investment advice.
Related markets
Shares a vertical MP4 loop to your phone's camera roll or app share sheet (Instagram, TikTok, Facebook Reels).
Alphabet's aggressive capital expenditures for 2026, which are forecast to hit as much as $205 billion, signal substantial future depreciation charges, with the most significant impact on its income statement anticipated from 2027 onwards, urging investors to consider its long-term profitability amidst this operational shift.
### Money Play Investors should consider the long-term impact of increased depreciation expenses on Alphabet's profitability, as these charges are set to materialize in 2027 and beyond. This scenario highlights how substantial capital investment cycles can affect reported earnings over time.
## Catalyst Analysis: Escalating Depreciation Expenses Alphabet's capital expenditures for 2026 are guided between $195 billion and $205 billion, a significant increase from previous forecasts. Approximately 60% of last quarter's infrastructure investment was allocated to servers, with the remaining 40% directed towards data centers and networking equipment. This substantial spending is set to translate into increased depreciation expenses in the coming quarters and years.
While revenue for the company rose 24% year over year to $119.8 billion and Google Cloud revenue grew 82% to $24.8 billion, operating income for the entire company increased by 30%. However, costs of revenues, excluding traffic acquisition costs, climbed 22% last quarter, with depreciation cited as a contributing factor. Research and development expenses also grew by 32%, partly due to increased AI talent acquisition and depreciation. Management has explicitly stated that this surge in infrastructure investment will continue to pressure the profit and loss statement through higher depreciation and related data center operational costs, such as energy.
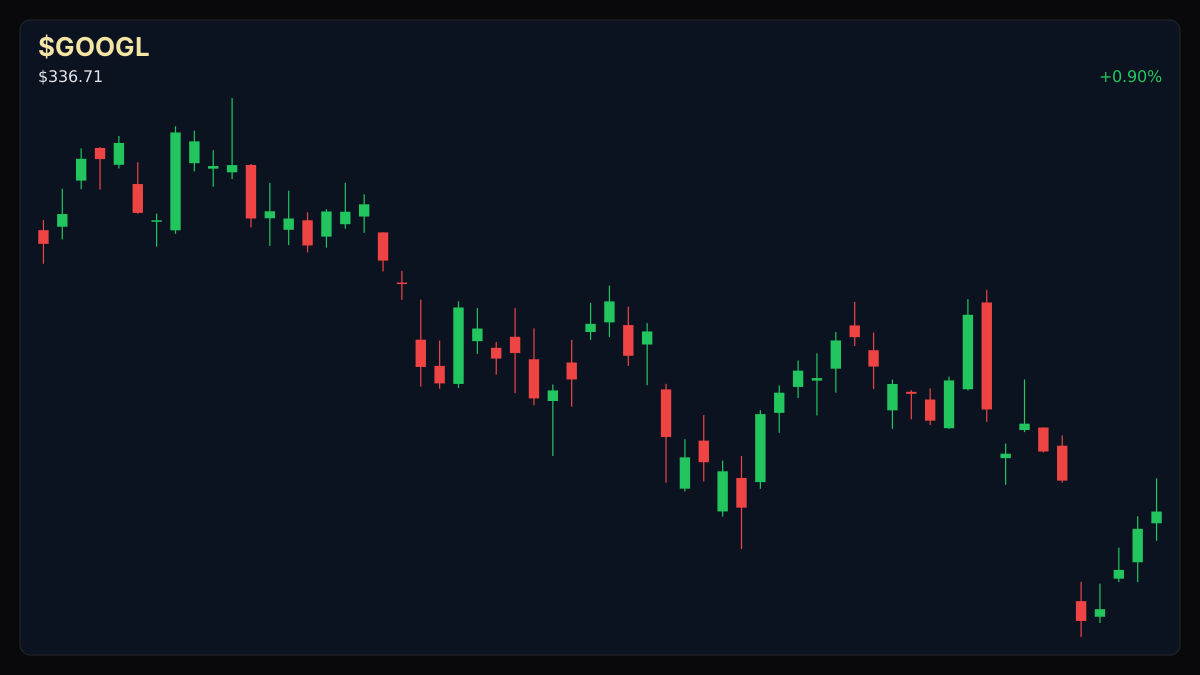
## $GOOGL+WL Technical Analysis & Key Risk Watch As of today, Thursday, July 30, 2026, Alphabet (NASDAQ: GOOGL) last traded at $333.71. $GOOGL+WL's 50-day Simple Moving Average (SMA50) stands at $361.84, while its 200-day Simple Moving Average (SMA200) is $324.75. The Relative Strength Index (RSI14) is 36.9, suggesting the stock is approaching oversold conditions. Volume is at 0.92x its 20-day average.
### Sector Ripple / Impact on Technology Sector The substantial capital outlays by Alphabet illuminate a trend of heavy investment in infrastructure, particularly for AI capabilities and cloud services, that could impact other major technology companies. This large-scale spending could create competitive pressures within the cloud and AI infrastructure sectors, potentially forcing other players to increase their own capital expenditures to keep pace. The focus on future depreciation as a significant cost driver signals that the profitability of large technology firms may increasingly depend on efficient asset utilization and long-term depreciation management strategies.
Read the full story
Original reporting and related coverage — attribution links only, not paid recommendations.
Trade this story
 Robinhood
 Webull
 Tradier
 IBKR
IBKR
Chart this story
 TradingView
Broker and exchange buttons use invite / refer-a-friend links (rewards may be capped). Charting links (TradingView) are partner offers that may pay OppHub America a commission at no extra cost to you.
OppSHOP
Full OppSHOP →As an Amazon Associate, OppHub America earns from qualifying purchases. Shopping here helps keep the site free — at no extra cost to you. Disclosure

OppSHOP
Related to this story
Investors should monitor Alphabet's ongoing capital expenditure trends a
Shop related →

Investing books
Read the classics
Shop this pick →

Personal finance books
Run the household books
Shop this pick →

Trading notebooks
Write the thesis first
Shop this pick →

Monitor for charts
See every pane
Shop this pick →
Story playbook
A pre-built map of what to watch — stocks, ETFs, and educational next steps. Not personalized advice.
Snapshot date: July 30, 2026 at 5:02 AM ET
This playbook was built when the story published and is not live-updated. Prices, news, and risk can change after this date — treat it as a starting map, not a current trade ticket.
Story → money map
AI infrastructure spending
Google's parent company is spending a huge amount of money on data centers and computers, which will lead to high costs on their financial reports starting in a few years. People managing money are watching this closely because it could reduce future reported profits.
What changed
Alphabet's projected massive capital expenditures for 2026 signal substantial future depreciation charges hitting its income statement starting in 2027.
Who wins / who loses
Hardware and infrastructure suppliers benefit from the heavy spending today, while Alphabet's future reported profit margins face potential pressure from higher depreciation costs.
Time horizon
Think in terms of the next few months.
Confidence & best fit
medium confidence · Long-term investor
Safer theme exposure (ETFs)
Baskets that own the theme without betting on one company.
Single stocks (higher risk)
Primary = closest to the story · Peers = same industry · Second-order = knock-on effects · Avoid = looks related but may be a trap
Primary
- $GOOGLWatch — track, don’t rush
Google is spending a ton of money on gear right now, which means higher costs on their books in the future.
View $GOOGL chart → · End-of-day delayed data
Peer
- $MSFTWatch — track, don’t rush
Other big tech giants are also spending massive amounts of money on similar computer systems.
View $MSFT chart → · End-of-day delayed data
Second-order
- $NVDABuild slowly — only if it fits your plan
Chipmakers sell the expensive hardware that Google is buying in huge quantities.
View $NVDA chart → · End-of-day delayed data
Options (education only)
No strikes or expiries — a framework for how traders might express the view. Options can expire worthless.
Beginners should skip complex options here and focus on the long-term stock trend.
See options-friendly brokers →Income / OppHub America angle
Not a trade tip — ways to use the insight outside the market.
- Monitor enterprise cloud growth rates to see if heavy infrastructure spending successfully drives new revenue.
What would break this thesis
- Alphabet accelerates cloud revenue growth fast enough to easily offset rising depreciation expenses.
What to do next on OppHub America
Saved playbooks stay on this device for now.
Important
Not financial advice. OppHub America playbooks are educational market maps only — not recommendations to buy, sell, or hold any security. Markets move fast; information can be wrong or outdated. Trade and invest at your own risk. Do your own research or consult a licensed advisor.
Based on reporting from yahoo-megacap-tickers.
Informational and educational only — not investment, financial, or legal advice. Disclosure
Shares a vertical MP4 loop to your phone's camera roll or app share sheet (Instagram, TikTok, Facebook Reels).