Barry, OppHub America Desk · · Source: yahoo-megacap-tickers
Core PCE Print: Inflation Metric Eyed After FOMC Meet
Investors should consider the broader market implications of this inflation data, as it can influence the Fed's monetary policy trajectory, impacting various asset classes.
Based on reporting from yahoo-megacap-tickers.
U.S. investors are closely watching the Personal Consumption Expenditures (PCE) data, particularly Core PCE, due next, Thursday, July 30, due to its significant influence on Federal Reserve policy beyond the recent FOMC meeting. This inflation metric, excluding volatile food and energy, is the Fed's preferred gauge, informing future rate decisions that can impact broader market performance.
Market context for this story
As of: PremarketLoading quotes…
Informational only — not investment advice. Full markets →
 $TSLA
$TSLA$TSLA
TradingView
Live chart & market data via TradingView · OppHub classroom · Delayed or exchange real-time per TradingView data agreements · Not investment advice
Educational TradingView chart — search any symbol in the widget. Confirm on /markets/TSLA. Not investment advice.
Related markets
Shares a vertical MP4 loop to your phone's camera roll or app share sheet (Instagram, TikTok, Facebook Reels).
U.S. investors are closely watching the Personal Consumption Expenditures (PCE) data, particularly Core PCE, due next, Thursday, July 30, due to its significant influence on Federal Reserve policy beyond the recent FOMC meeting. This inflation metric, excluding volatile food and energy, is the Fed's preferred gauge, informing future rate decisions that can impact broader market performance.
### Money Play Investors should consider the broader market implications of this inflation data, as it can influence the Fed's monetary policy trajectory, impacting various asset classes.
### Executive Thesis The July 30 Core PCE release holds significant weight for the U.S. financial landscape, potentially steering Federal Reserve policy more than the recently concluded FOMC meeting. With consumer price inflation experiencing volatility, the Fed's preferred measure offers a clearer signal on underlying inflationary pressures. This data point will be crucial for assessing the Fed's dual mandate objectives and its path forward on interest rates.
### The Print vs Consensus Headline inflation rose from 2.4% in February to 4.2% in May, then dropped to 3.5% in June. The Federal Reserve's preferred inflation measure, Core PCE, moved up to 3.4% in May, marking its highest level since October 2023. Forecasts predict Core PCE to ease slightly to 3.33% in June from May's 3.4% but project an inch higher to 3.36% in July.
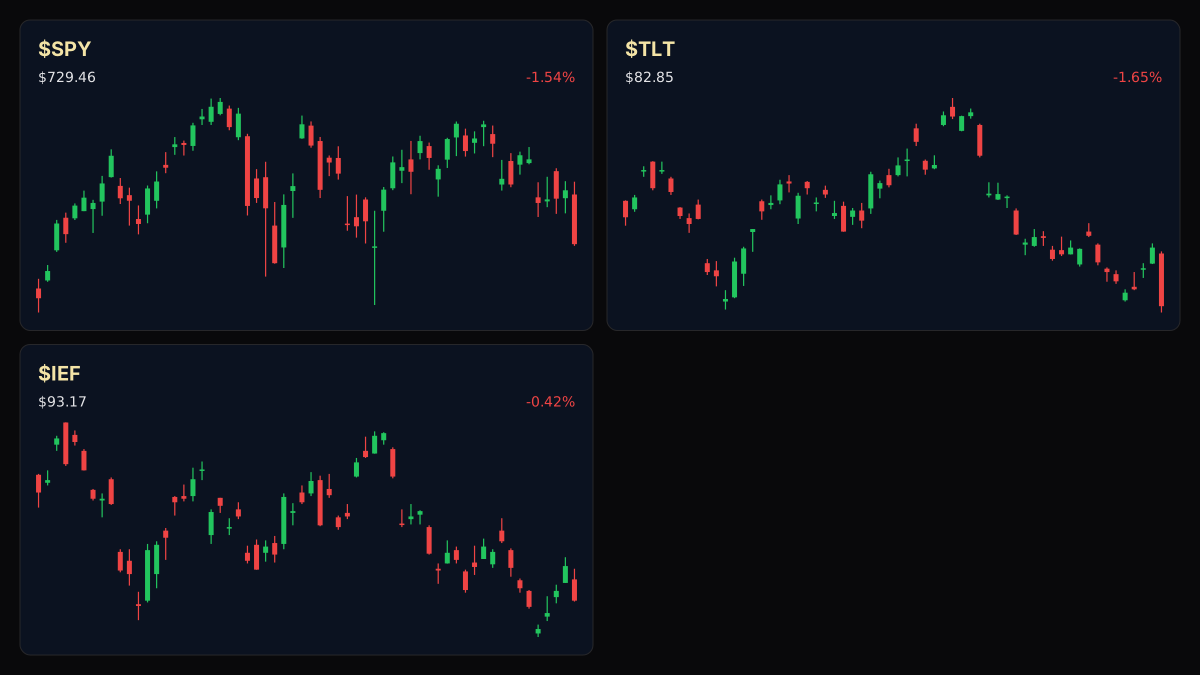
### Market Reaction Market indices observed significant movements, with the Dow Jones Industrial Average falling 2.19%, the S&P 500 benchmark dropping 1.52%, and the Nasdaq Composite decreasing by 1.74%. These movements reflect market sentiment ahead of key economic data releases that could influence future monetary policy. $TSLA+WL's RSI at 17.2 signals an oversold condition.
### What It Means for Policy & Positioning The sustained elevated levels in Core PCE, consistently above the Fed's 2% target, suggest persistent inflationary pressures that could influence the Federal Reserve's stance on future interest rate adjustments. Divergence between headline and Core PCE inflation indicates that inflationary effects may be broadening beyond energy, affecting a wider range of consumer goods. This could compel the Fed to maintain a more hawkish posture than a focus on headline inflation alone might imply, impacting borrowing costs and investment decisions across the U.S. economy.
### Next Calendar Watch No specific next related print date was
Read the full story
Original reporting and related coverage — attribution links only, not paid recommendations.
Trade this story
 Robinhood
 Webull
 Tradier
 IBKR
IBKR
Chart this story
 TradingView
Broker and exchange buttons use invite / refer-a-friend links (rewards may be capped). Charting links (TradingView) are partner offers that may pay OppHub America a commission at no extra cost to you.
OppSHOP
Full OppSHOP →As an Amazon Associate, OppHub America earns from qualifying purchases. Shopping here helps keep the site free — at no extra cost to you. Disclosure

OppSHOP
Related to this story
Investors should consider the broader market implications of this inflat
Shop related →

Investing books
Read the classics
Shop this pick →

Personal finance books
Run the household books
Shop this pick →

Trading notebooks
Write the thesis first
Shop this pick →

Monitor for charts
See every pane
Shop this pick →
Story playbook
A pre-built map of what to watch — stocks, ETFs, and educational next steps. Not personalized advice.
Snapshot date: July 30, 2026 at 4:56 AM ET
This playbook was built when the story published and is not live-updated. Prices, news, and risk can change after this date — treat it as a starting map, not a current trade ticket.
Story → money map
macro inflation and interest rates
The government released a key inflation report that the Federal Reserve uses to decide on interest rates. Beginners should care because interest rates affect borrowing costs, stock prices, and the overall economy.
What changed
Core PCE inflation data for June 2026 was released, shaping the Federal Reserve's upcoming monetary policy decisions.
Who wins / who loses
Fixed income and growth stocks benefit if inflation cools, while rate-sensitive sectors and cash-heavy portfolios face volatility if inflation surprises to the upside.
Time horizon
Think in terms of the next few weeks.
Confidence & best fit
medium confidence · Long-term investor
Safer theme exposure (ETFs)
Baskets that own the theme without betting on one company.
Single stocks (higher risk)
Primary = closest to the story · Peers = same industry · Second-order = knock-on effects · Avoid = looks related but may be a trap
Primary
- $TLTWatch — track, don’t rush
Long-term government bonds that move opposite to interest rates and inflation expectations.
View $TLT chart → · End-of-day delayed data
Peer
- $XLFWatch — track, don’t rush
A basket of major banks and financial companies affected by shifting interest rates.
View $XLF chart → · End-of-day delayed data
Second-order
- $XLUWatch — track, don’t rush
Utility stocks that tend to move based on where interest rates are heading.
View $XLU chart → · End-of-day delayed data
Options (education only)
No strikes or expiries — a framework for how traders might express the view. Options can expire worthless.
Beginners should skip options around major economic data releases because prices can whip around in both directions quickly.
See options-friendly brokers →Income / OppHub America angle
Not a trade tip — ways to use the insight outside the market.
- Review personal high-yield savings accounts or short-term certificates of deposit to lock in rates before potential Fed cuts.
What would break this thesis
- A massive unexpected revision to prior month inflation data.
- Unrelated geopolitical shocks that completely override domestic inflation data in market pricing.
What to do next on OppHub America
Saved playbooks stay on this device for now.
Important
Not financial advice. OppHub America playbooks are educational market maps only — not recommendations to buy, sell, or hold any security. Markets move fast; information can be wrong or outdated. Trade and invest at your own risk. Do your own research or consult a licensed advisor.
Based on reporting from yahoo-megacap-tickers.
Informational and educational only — not investment, financial, or legal advice. Disclosure
Shares a vertical MP4 loop to your phone's camera roll or app share sheet (Instagram, TikTok, Facebook Reels).