Barry, OppHub America Desk · · Source: yahoo-tickers-tape-movers
Applied Materials vs. Broadcom: Semiconductor Growth Comparison
Portfolio allocation in semiconductor equities depends on balancing manufacturing equipment exposure against fabless design concentration.
Based on reporting from yahoo-tickers-tape-movers.
As of Thursday, October 1, 2026, semiconductor equity positioning highlights a fundamental evaluation between equipment manufacturer Applied Materials and chip designer Broadcom. Investors weighing equipment exposure against design infrastructure analyze valuation ratios, gross margins, and customer concentration risks for positioning decisions.
Market context for this story
As of: Regular HoursLoading quotes…
Informational only — not investment advice. Full markets →


$AMATApplied Materials
TradingView
Live chart & market data via TradingView · OppHub classroom · Delayed or exchange real-time per TradingView data agreements · Not investment advice
Educational TradingView chart — search any symbol in the widget. Confirm on /markets/AMAT and related $TSM, $AAPL. Not investment advice.
Related markets
Shares a vertical MP4 loop to your phone's camera roll or app share sheet (Instagram, TikTok, Facebook Reels).
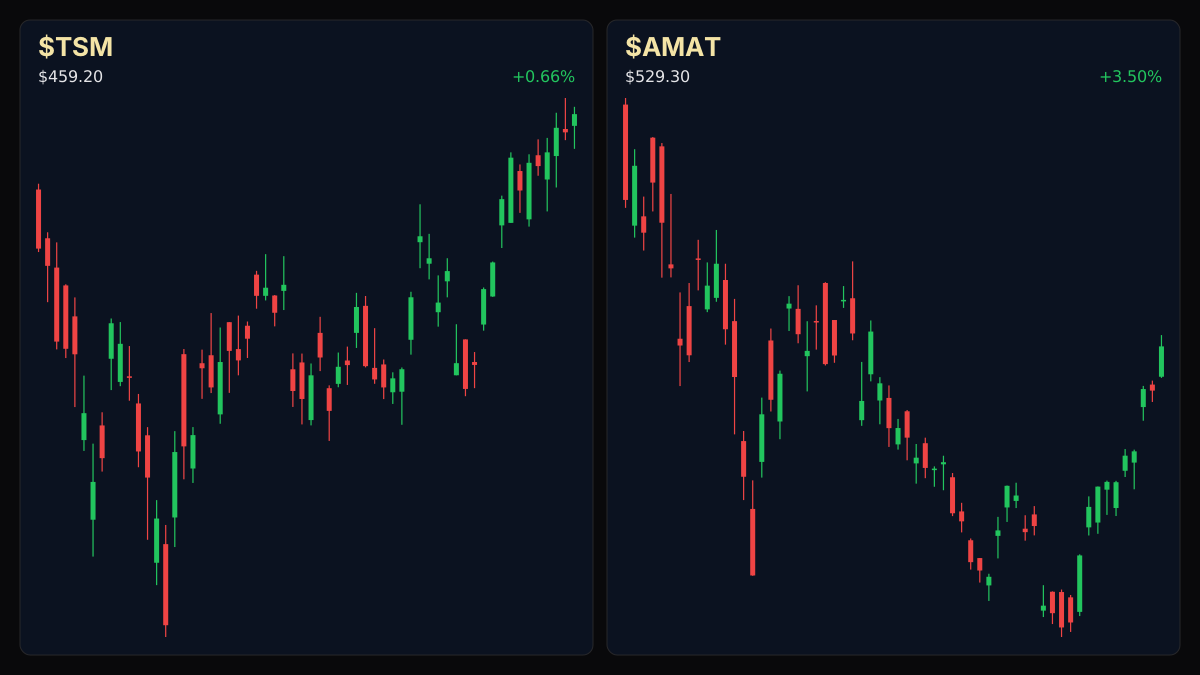
### Session Tape - Applied Materials ($AMAT+WL): $529.30 (+3.50% / +$17.92) - Broadcom (AVGO): $343.64 (-2.15% / -$7.55)
## Catalyst Analysis: Equipment Versus Design Infrastructure Evaluating semiconductor infrastructure exposure requires distinguishing between manufacturing equipment providers and fabless design leaders. Applied Materials supplies hardware essential for advanced semiconductor fabrication, reporting a gross margin of 49.40%, a trailing P/E ratio of 44.10, and trailing earnings per share (EPS TTM) of $11.60 alongside a market capitalization of $406 billion.
Conversely, Broadcom focuses on enterprise software integration and custom chip architecture. Broadcom reported a gross margin of 66.54%, a trailing P/E ratio of 44.83, and an EPS (TTM) of $7.83, supported by major partnerships and high customer concentration where specific buyers account for substantial portions of net revenue.
## Impact on Related Tickers Portfolio allocations across the semiconductor supply chain involve monitoring interconnected hardware providers and foundry partners. Advanced microchip manufacturing operations tied to entities such as Taiwan Semiconductor Manufacturing Company ($TSM+WL +0.66%) and specialized device integrations with Apple (AAPL -0.81%) reflect the broader capital expenditure cycles governing both equipment fabrication and silicon design segments.
Read the full story
Original reporting and related coverage — attribution links only, not paid recommendations.
Trade this story
 Robinhood
 Webull
 Tradier
 IBKR
IBKR
Chart this story
 TradingView
Broker and exchange buttons use invite / refer-a-friend links (rewards may be capped). Charting links (TradingView) are partner offers that may pay OppHub America a commission at no extra cost to you.
OppSHOP
Full OppSHOP →As an Amazon Associate, OppHub America earns from qualifying purchases. Shopping here helps keep the site free — at no extra cost to you. Disclosure

OppSHOP
Related to this story
Portfolio allocation in semiconductor equities depends on balancing manu
Shop related →

Investing books
Read the classics
Shop this pick →

Personal finance books
Run the household books
Shop this pick →

Trading notebooks
Write the thesis first
Shop this pick →

Monitor for charts
See every pane
Shop this pick →
Story playbook
A pre-built map of what to watch — stocks, ETFs, and educational next steps. Not personalized advice.
Snapshot date: October 1, 2026 at 5:36 PM ET
This playbook was built when the story published and is not live-updated. Prices, news, and risk can change after this date — treat it as a starting map, not a current trade ticket.
Story → money map
Semiconductor Equipment vs Design
Investors are comparing two different types of chip companies: ones that build the factory equipment and ones that design the actual microchips. People care because choosing the right one affects how safely your money grows as technology spending changes.
What changed
Market performance diverged between semiconductor manufacturing equipment makers and custom chip designers, highlighting valuation and margin differences.
Who wins / who loses
Equipment suppliers like Applied Materials gained session momentum, while chip designers like Broadcom saw minor pullbacks.
Time horizon
Think in terms of the next few months.
Confidence & best fit
medium confidence · Long-term investor
Safer theme exposure (ETFs)
Baskets that own the theme without betting on one company.
Single stocks (higher risk)
Primary = closest to the story · Peers = same industry · Second-order = knock-on effects · Avoid = looks related but may be a trap
Primary
- $AMATWatch — track, don’t rush
This company makes the heavy machinery used to build microchips, benefiting when factories expand.
View $AMAT chart → · End-of-day delayed data
- $AVGOWatch — track, don’t rush
This company designs custom chips and software, but relies heavily on a few massive corporate clients.
View $AVGO chart → · End-of-day delayed data
Second-order
- $TSMWatch — track, don’t rush
This massive foundry actually manufactures the chips that designers create and equipment makers service.
View $TSM chart → · End-of-day delayed data
- $AAPLStay away — for now
As a major tech giant, its product demand heavily influences the revenue of chip designers.
View $AAPL chart → · End-of-day delayed data
Options (education only)
No strikes or expiries — a framework for how traders might express the view. Options can expire worthless.
Beginners should skip options here due to high volatility and valuation swings in tech stocks.
See options-friendly brokers →Income / OppHub America angle
Not a trade tip — ways to use the insight outside the market.
- Monitor global electronics demand and corporate data center spending reports.
What would break this thesis
- A sudden drop in global semiconductor capital expenditures or major supply chain disruptions.
What to do next on OppHub America
Saved playbooks stay on this device for now.
Important
Not financial advice. OppHub America playbooks are educational market maps only — not recommendations to buy, sell, or hold any security. Markets move fast; information can be wrong or outdated. Trade and invest at your own risk. Do your own research or consult a licensed advisor.
Based on reporting from yahoo-tickers-tape-movers.
Informational and educational only — not investment, financial, or legal advice. Disclosure
Shares a vertical MP4 loop to your phone's camera roll or app share sheet (Instagram, TikTok, Facebook Reels).