Barry, OppHub America Desk · · Source: yahoo-tickers-tape-movers
ASML Holdings Stock Slid 11.5% in October Despite Earnings Beat
As semiconductor equipment leaders navigate sector-wide rotation, market participants watch momentum indicators across major tech components for potential mean-reversion setups.
Based on reporting from yahoo-tickers-tape-movers.
ASML Holdings absorbed an 11.5% pullback through October despite posting robust quarterly metrics, weighed down by broader semiconductor sector rotation and AI sentiment pressures. Investors weighed the fundamental strength against shifting tape momentum heading toward late 2026.
Market context for this story
As of: WeekendLoading quotes…
Informational only — not investment advice. Full markets →


$ASMLASML Holdings
TradingView
Live chart & market data via TradingView · OppHub classroom · Delayed or exchange real-time per TradingView data agreements · Not investment advice
$XLKTechnology Select Sector
TradingView
Live chart & market data via TradingView · OppHub classroom · Delayed or exchange real-time per TradingView data agreements · Not investment advice
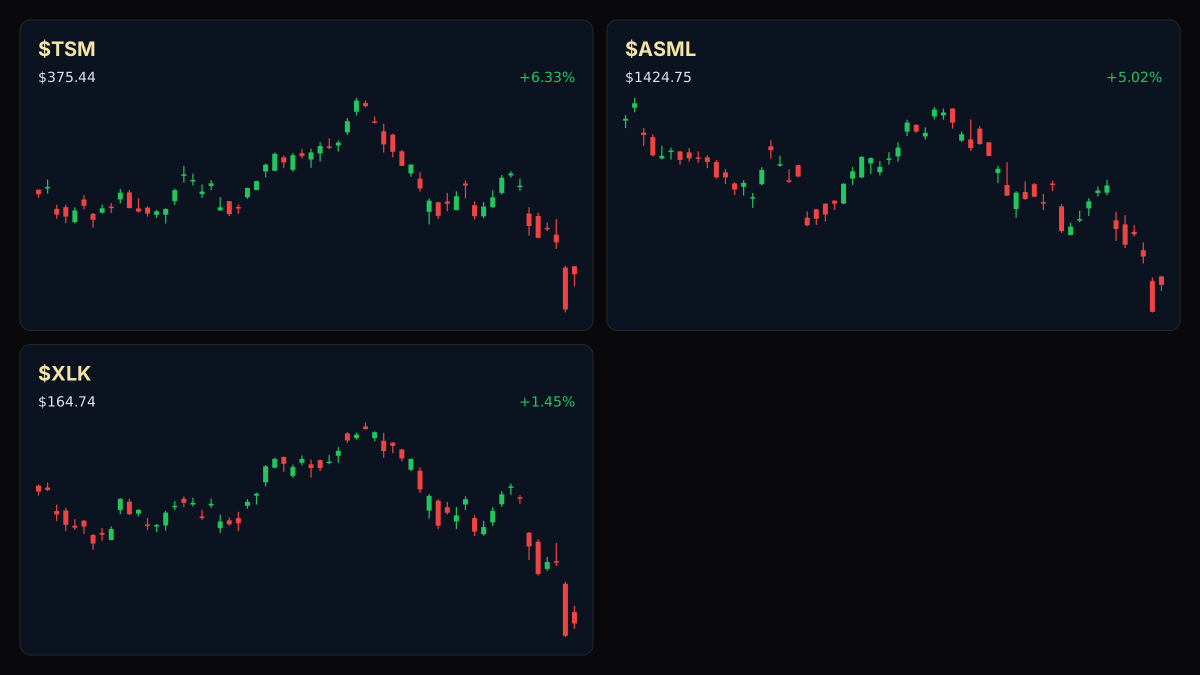
Educational TradingView charts — search any symbol in the widget. Confirm on /markets/ASML and related $XLK, $TSM, $NVDA. Not investment advice.
Related markets
Shares a vertical MP4 loop to your phone's camera roll or app share sheet (Instagram, TikTok, Facebook Reels).
## Session Tape — $ASML+WL Holdings Sector Backdrop - **$ASML+WL Holdings ($ASML+WL):** Recorded an 11.5% monthly decline in October alongside a 5.02% session move, matching broader volatility across key semiconductor holdings.
## Catalyst Analysis: Fundamental Outperformance vs. Sector Volatility $ASML+WL Holdings reported third-quarter revenue growth of 55.2% year-over-year to 11.7 billion euros, while adjusted earnings per share jumped 135.9% to 12.53 euros. The company also outlined plans to expand capacity by more than 30% for 2028. However, market participants elected to take profits and reallocate capital amid broader risk-off sentiment in the technology sector, proving that headline fundamental metrics alone could not override prevailing sector drawdowns.
## Technical Analysis & Key Risk Watch
With chip equipment equities trading through heightened volatility, traders continue to monitor broader market breadth and support zones across underlying tech benchmarks. For instance, related large-cap chip major $NVDA+WL shows an RSI14 reading of 26.9, signaling oversold momentum conditions across the semiconductor complex.
## Impact on Semiconductor Equities The divergence between $ASML+WL's operational delivery and its monthly price contraction highlights sensitivity across supply-chain bellwethers. Market participants tracking equipment providers are closely watching macroeconomic signals and index breadth for signs of stabilization.
Read the full story
Original reporting and related coverage — attribution links only, not paid recommendations.
Trade this story
 Robinhood
 Webull
 Tradier
 IBKR
Chart this story
 TradingView
Broker and exchange buttons use invite / refer-a-friend links (rewards may be capped). Charting links (TradingView) are partner offers that may pay OppHub America a commission at no extra cost to you.
OppSHOP
Full OppSHOP →As an Amazon Associate, OppHub America earns from qualifying purchases. Shopping here helps keep the site free — at no extra cost to you. Disclosure

OppSHOP
Related to this story
As semiconductor equipment leaders navigate sector-wide rotation, market
Shop related →

Investing books
Read the classics
Shop this pick →

Personal finance books
Run the household books
Shop this pick →

Trading notebooks
Write the thesis first
Shop this pick →

Monitor for charts
See every pane
Shop this pick →
Story playbook
A pre-built map of what to watch — stocks, ETFs, and educational next steps. Not personalized advice.
Snapshot date: November 8, 2026 at 5:06 PM ET
This playbook was built when the story published and is not live-updated. Prices, news, and risk can change after this date — treat it as a starting map, not a current trade ticket.
Story → money map
Semiconductor Sector Rotation
ASML made a lot of money and grew fast, but its stock price still dropped because investors are currently selling tech stocks across the board. Money people care because this shows that even great companies can see their stock fall when the overall market mood turns cautious.
What changed
ASML reported massive year-over-year revenue and earnings growth, yet its stock pulled back 11.5% in October due to sector-wide tech rotation and profit-taking.
Who wins / who loses
Semiconductor equipment suppliers and tech bellwethers face short-term selling pressure, while value-seeking buyers watch for mean-reversion entries.
Time horizon
Think in terms of the next few weeks.
Confidence & best fit
medium confidence · Long-term investor, Active trader
Safer theme exposure (ETFs)
Baskets that own the theme without betting on one company.
Single stocks (higher risk)
Primary = closest to the story · Peers = same industry · Second-order = knock-on effects · Avoid = looks related but may be a trap
Primary
- $ASMLBuild slowly — only if it fits your plan
The company is doing great business, but its stock price is down, which might make it a good deal for long-term buyers.
View $ASML chart → · End-of-day delayed data
Peer
- $TSMWatch — track, don’t rush
A key manufacturing partner that often moves up and down right along with ASML.
View $TSM chart → · End-of-day delayed data
Second-order
- $NVDAWatch — track, don’t rush
A giant chipmaker whose low momentum indicator signals the whole tech sector is currently oversold.
View $NVDA chart → · End-of-day delayed data
Options (education only)
No strikes or expiries — a framework for how traders might express the view. Options can expire worthless.
Direction: bullish · Style: Bullish defined-risk call idea · Level: intermediate
Buying options lets you bet that the stock will bounce back, but beginners should probably stick to buying regular shares or skip options because they can lose value quickly.
Income / OppHub America angle
Not a trade tip — ways to use the insight outside the market.
- Monitor global semiconductor capital expenditure announcements and fab expansion updates.
What would break this thesis
- Broader macroeconomic risk-off sentiment deepens, breaking major technical support levels across the Nasdaq and chip indices.
What to do next on OppHub America
Saved playbooks stay on this device for now.
Important
Not financial advice. OppHub America playbooks are educational market maps only — not recommendations to buy, sell, or hold any security. Markets move fast; information can be wrong or outdated. Trade and invest at your own risk. Do your own research or consult a licensed advisor.
Based on reporting from yahoo-tickers-tape-movers.
Informational and educational only — not investment, financial, or legal advice. Disclosure
Shares a vertical MP4 loop to your phone's camera roll or app share sheet (Instagram, TikTok, Facebook Reels).