OppHub America Desk · · Source: yahoo-tickers-tape-movers
Stock Market Correction & Tape Movers: S&P 500 and Nasdaq Index Context
Portfolio diversification and historical risk management rules remain core focal points for market participants navigating broader index corrections.
Based on reporting from yahoo-tickers-tape-movers.
As major equity benchmarks navigate correction territory amid shifting index levels, market participants assess portfolio resilience and historical crash-survival rules. The Nasdaq Composite and S&P 500 reflect recent pullback metrics alongside active single-stock tape movement.
Market context for this story
As of: WeekendLoading quotes…
Informational only — not investment advice. Full markets →


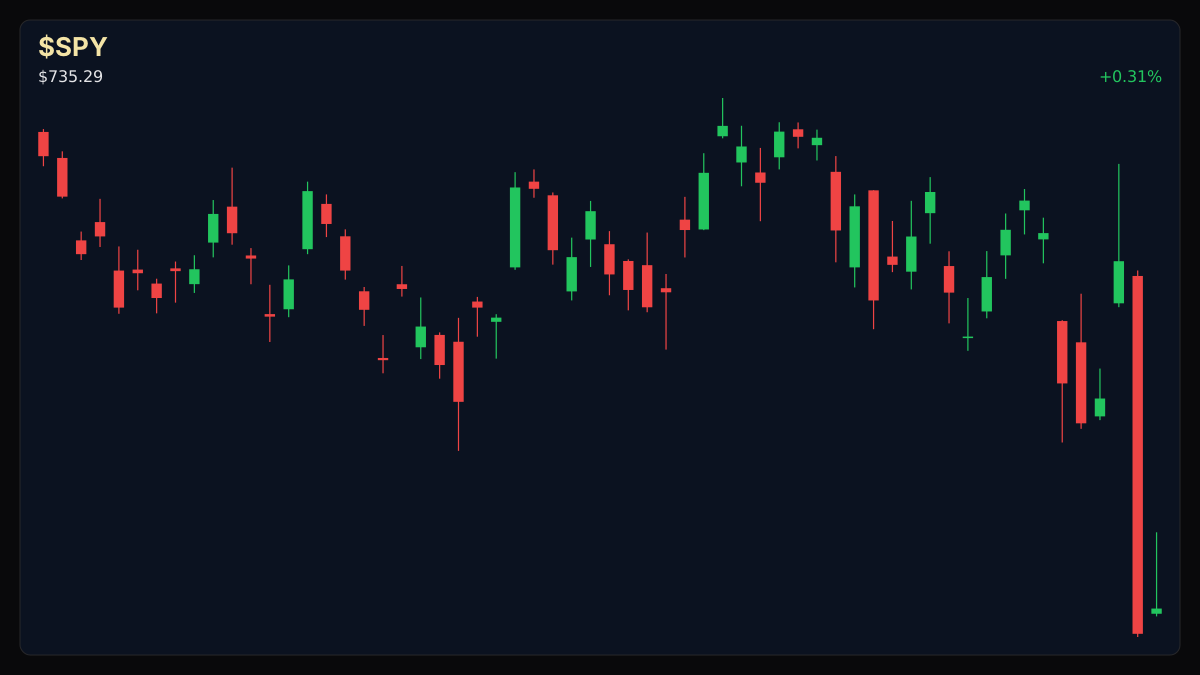
$SPYSPDR S&P 500 ETF
TradingView
Live chart & market data via TradingView · OppHub classroom · Delayed or exchange real-time per TradingView data agreements · Not investment advice
$TSLA
TradingView
Live chart & market data via TradingView · OppHub classroom · Delayed or exchange real-time per TradingView data agreements · Not investment advice
Educational TradingView charts — search any symbol in the widget. Confirm on /markets/SPY and related $TSLA, $GOOGL, $NVDA. Not investment advice.
Related markets
Shares a vertical MP4 loop to your phone's camera roll or app share sheet (Instagram, TikTok, Facebook Reels).
### Session Tape - S&P 500: 7,376.86 (+0.3%) - Dow Jones Industrial Average: 51,285.73 (-0.5%) - Nasdaq Composite: 24,579.42 (+1.1%) - Bitcoin: $74,189.00 (-2.0%) - SPCX: $134.27 (+8.6%) - Apple (AAPL): $342.37 (-0.5%) - Amazon (AMZN): $259.30 (-0.3%) - Alphabet (GOOG): $283.93 (+0.8%) - Meta Platforms (META): $610.15 (+0.8%) - Microsoft (MSFT): $530.61 (-1.0%) - Nvidia (NVDA): $186.64 (+2.8%) - Tesla (TSLA): $358.22 (+4.2%)
## Catalyst Analysis: Index Correction & Broad Tape Action Market participants continue to monitor broader index shifts as the Nasdaq Composite previously entered correction territory after pulling back more than 10% from prior peak levels, while the S&P 500 and Dow Jones Industrial Average register respective pullbacks. Against this macroeconomic backdrop, investors revisit long-term asset allocation principles and historical volatility frameworks to gauge portfolio stability during market pullbacks.
## Technical Analysis & Key Risk Watch
Technical conditions across major large-cap tech equities display varied momentum indicators and volume profiles as the weekend session unfolds. Market participants tracking single-stock positioning observe relative strength and weakness across the tape without relying on single-session percentage swings as fundamental catalysts.
Read the full story
Original reporting and related coverage — attribution links only, not paid recommendations.
Trade this story
 Robinhood
 Webull
 Tradier
 IBKR
Chart this story
 TradingView
Broker and exchange buttons use invite / refer-a-friend links (rewards may be capped). Charting links (TradingView) are partner offers that may pay OppHub America a commission at no extra cost to you.
OppSHOP
Full OppSHOP →As an Amazon Associate, OppHub America earns from qualifying purchases. Shopping here helps keep the site free — at no extra cost to you. Disclosure

OppSHOP
Related to this story
Portfolio diversification and historical risk management rules remain co
Shop related →

Investing books
Read the classics
Shop this pick →

Personal finance books
Run the household books
Shop this pick →

Trading notebooks
Write the thesis first
Shop this pick →

Monitor for charts
See every pane
Shop this pick →
Based on reporting from yahoo-tickers-tape-movers.
Informational and educational only — not investment, financial, or legal advice. Disclosure
Shares a vertical MP4 loop to your phone's camera roll or app share sheet (Instagram, TikTok, Facebook Reels).