Barry, OppHub America Desk · · Source: yahoo-tickers-tape-movers
AST SpaceMobile vs. GE Aerospace: Valuation & Metrics Compared
Market participants evaluating aerospace and industrial allocations must weigh early-stage growth potential against cash-generative stability.
Based on reporting from yahoo-tickers-tape-movers.
Comparing emerging space connectivity developer AST SpaceMobile against legacy industrial giant GE Aerospace highlights a stark contrast in valuation, margins, and operational scale as markets assess industrial equities on Wednesday, September 30, 2026. Investors evaluating aerospace and defense allocations weigh AST SpaceMobile's $18 billion market capitalization and negative trailing earnings against GE Aerospace's $330 billion valuation, positive margins, and dividend yields.
Market context for this story
As of: Regular HoursLoading quotes…
Informational only — not investment advice. Full markets →


$GEGE Aerospace
TradingView
Live chart & market data via TradingView · OppHub classroom · Delayed or exchange real-time per TradingView data agreements · Not investment advice
Educational TradingView chart — search any symbol in the widget. Confirm on /markets/GE and related $ASTS. Not investment advice.
Related markets
Shares a vertical MP4 loop to your phone's camera roll or app share sheet (Instagram, TikTok, Facebook Reels).
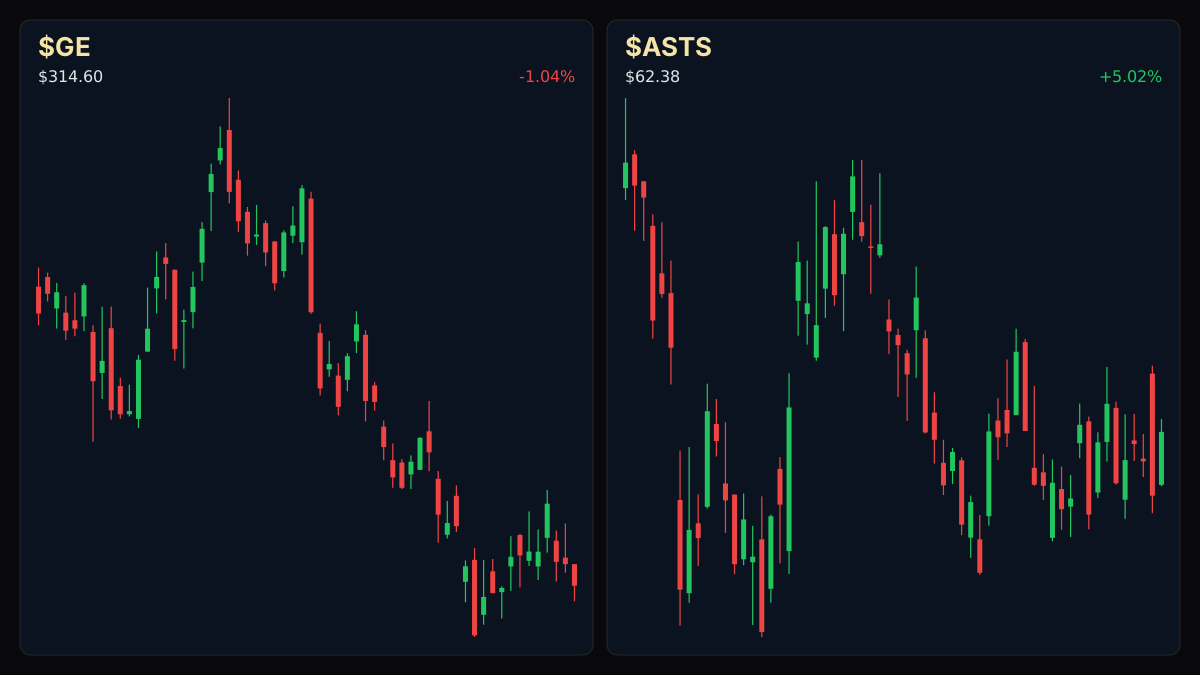
### Session Tape — Wednesday, September 30, 2026 - AST SpaceMobile ($ASTS+WL): $62.27 (+4.83% | +$2.87) - GE Aerospace ($GE+WL): $314.64 (-1.02% | -$3.26)
## Catalyst Analysis: Valuation and Financial Metrics Evaluating industrial and aerospace equities on Wednesday, September 30, 2026, requires parsing two distinct corporate profiles: early-stage developmental infrastructure and established industrial manufacturing. AST SpaceMobile operates with a market capitalization of $18 billion, a 52-week range spanning $49.31 to $133.86, a negative trailing twelve-month EPS of -$2.14, and an unspecified dividend yield. In contrast, GE Aerospace commands a $330 billion market capitalization with a 52-week range between $268.91 and $388.84, a trailing P/E ratio of 37.47, a TTM EPS of $8.48, and a dividend of $1.66 yielding 0.52%.
## Fundamental Divergence The structural disparity between the two enterprises is underscored by profitability metrics. GE Aerospace reports a gross margin of 35.23%, reflecting established industrial cash flows and operational scale. Meanwhile, AST SpaceMobile exhibits developmental financial characteristics typical of emerging space and satellite communications providers, where early capital expenditures precede commercial monetization at scale.
Read the full story
Original reporting and related coverage — attribution links only, not paid recommendations.
Trade this story
 Robinhood
 Webull
 Tradier
 IBKR
IBKR
Chart this story
 TradingView
Broker and exchange buttons use invite / refer-a-friend links (rewards may be capped). Charting links (TradingView) are partner offers that may pay OppHub America a commission at no extra cost to you.
OppSHOP
Full OppSHOP →As an Amazon Associate, OppHub America earns from qualifying purchases. Shopping here helps keep the site free — at no extra cost to you. Disclosure

OppSHOP
Related to this story
Market participants evaluating aerospace and industrial allocations must
Shop related →

Investing books
Read the classics
Shop this pick →

Personal finance books
Run the household books
Shop this pick →

Trading notebooks
Write the thesis first
Shop this pick →

Monitor for charts
See every pane
Shop this pick →
Story playbook
A pre-built map of what to watch — stocks, ETFs, and educational next steps. Not personalized advice.
Snapshot date: September 30, 2026 at 1:01 PM ET
This playbook was built when the story published and is not live-updated. Prices, news, and risk can change after this date — treat it as a starting map, not a current trade ticket.
Story → money map
Aerospace valuation divergence
The market is comparing a risky, high-potential space internet company with a massive, profitable aviation manufacturer. Investors are deciding whether to chase big future growth or stick with steady, reliable industrial giants.
What changed
A market valuation comparison highlights the divergence between speculative space connectivity growth and cash-generative industrial manufacturing.
Who wins / who loses
Established aerospace manufacturers with steady cash flows benefit from conservative allocations, while speculative space infrastructure developers experience higher volatility.
Time horizon
Think in terms of the next few weeks.
Confidence & best fit
medium confidence · Long-term investor, Active trader
Safer theme exposure (ETFs)
Baskets that own the theme without betting on one company.
Single stocks (higher risk)
Primary = closest to the story · Peers = same industry · Second-order = knock-on effects · Avoid = looks related but may be a trap
Primary
- $ASTSWatch — track, don’t rush
An early-stage space company with big promises but no current profits, making its stock very bouncy.
View $ASTS chart → · End-of-day delayed data
- $GEBuild slowly — only if it fits your plan
A massive, profitable manufacturing giant that makes airplane engines and pays steady returns.
View $GE chart → · End-of-day delayed data
Peer
- $LMTWatch — track, don’t rush
Another major defense and aerospace giant that provides a safe baseline for the industry.
View $LMT chart → · End-of-day delayed data
- $RKLBWatch — track, don’t rush
A smaller rocket-building company that moves similarly to the space connectivity trend.
View $RKLB chart → · End-of-day delayed data
Options (education only)
No strikes or expiries — a framework for how traders might express the view. Options can expire worthless.
Beginners should skip options here because the prices to buy contracts are too high and unpredictable.
See options-friendly brokers →Income / OppHub America angle
Not a trade tip — ways to use the insight outside the market.
- Monitor broader industrial sector earnings reports for signs of supply chain cost pressures.
What would break this thesis
- Sudden shifts in macroeconomic interest rate expectations or major commercial delays in satellite deployment.
What to do next on OppHub America
Saved playbooks stay on this device for now.
Important
Not financial advice. OppHub America playbooks are educational market maps only — not recommendations to buy, sell, or hold any security. Markets move fast; information can be wrong or outdated. Trade and invest at your own risk. Do your own research or consult a licensed advisor.
Based on reporting from yahoo-tickers-tape-movers.
Informational and educational only — not investment, financial, or legal advice. Disclosure
Shares a vertical MP4 loop to your phone's camera roll or app share sheet (Instagram, TikTok, Facebook Reels).