Barry, OppHub America Desk · · Source: seeking-alpha
Banking Bellwethers Kick Off Earnings & Fed Chair Speech
As economic prints and banking updates unfold, traders should monitor rate-sensitive sectors and financial bellwethers for shifts in monetary policy expectations.
Based on reporting from seeking-alpha.
As Wall Street prepares for banking bellwethers and inflation prints on Friday, October 10, 2026, investors eye potential macro headwinds following a sharp pullback in the AI trade and rising inflation expectations. Traders must navigate incoming CPI data, retail sales, and Fed commentary that could dictate rate path expectations.
Market context for this story
As of: WeekendLoading quotes…
Informational only — not investment advice. Full markets →


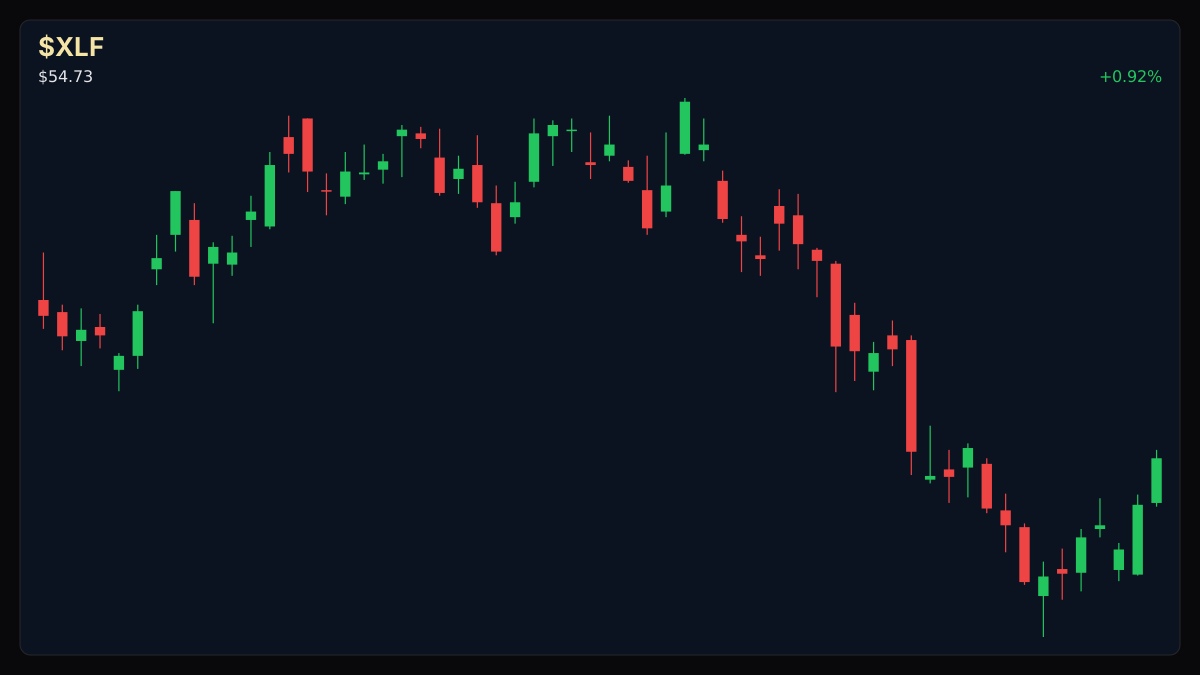
$XLFFinancial Select Sector
TradingView
Live chart & market data via TradingView · OppHub classroom · Delayed or exchange real-time per TradingView data agreements · Not investment advice
Educational TradingView chart — search any symbol in the widget. Confirm on /markets/XLF and related $TSM. Not investment advice.
Related markets
Shares a vertical MP4 loop to your phone's camera roll or app share sheet (Instagram, TikTok, Facebook Reels).
As Wall Street approaches a busy macroeconomic calendar on Friday, October 10, 2026, banking bellwethers and upcoming inflation prints take center stage amid shifting risk sentiment and cooling tech momentum.
### Executive Thesis Market participants are weighing decelerating revenue metrics in the artificial intelligence sector against sticky macro data, including October's initial consumer sentiment drop and accelerating inflation expectations. With heavy data releases ahead—spanning existing home sales, CPI, retail sales, PPI, and initial jobless claims—investors face heightened volatility as monetary policy expectations recalibrate around upcoming central bank commentary.
### The Print & Macro Calendar The upcoming economic slate features existing home sales data on Tuesday, September Consumer Price Index (CPI) figures on Wednesday, and Retail Sales alongside Producer Price Index (PPI) metrics on Thursday. Initial jobless claims are also scheduled for Thursday, culminating in a closely watched speech by Federal Reserve Chair Kevin Warsh on Friday.
### Market Reaction Equities sought stabilizing momentum on Friday following a Thursday tech contraction driven by OpenAI revenue data adjustments. Meanwhile, semiconductor bellwethers such as Taiwan Semiconductor ($TSM+WL) remain on watch ahead of scheduled earnings reports, while broader financial sector heavyweights prepare to set the tone for the reporting cycle.
### What It Means for Policy & Positioning Incoming inflation indicators and central bank remarks will heavily influence the policy path as traders parse whether cost pressures will constrain aggressive monetary easing. Positioning across equities requires heightened risk management as macro catalysts intersect with corporate earnings.
### Next Calendar Watch IMF meetings begin Monday, followed by the September existing home sales release on Tuesday and CPI figures on Wednesday.
### Money Play As macroeconomic data releases and banking earnings approach, investors are tracking sector sensitivity to inflation prints and central bank guidance without relying on single-sector ETF generalizations.
### Story Arc / How We Got Here This macro landscape follows prior high-commodity pressure periods, building on recent energy cost scrutiny highlighted in Brent Crude Above $100: Crypto Resilience Amid High Oil Prices.
### Story Arc / How We Got Here
This follows our earlier coverage ([Brent Crude Above $100: Crypto Resilience Amid High Oil Prices](/explore/brent-crude-above-100-crypto-resilience-oil-prices)) on 2026-10-03. Brent crude climbed to $103.64 per barrel as of Wednesday, October 1, 2026, marking a 34% rise over 90 days and a 62% gain year-to-date. Despite the energy surge and inflation pressures, major digital assets including Bitcoin gained 42% over the last three months, signaling decoupling or resilience against macro cost shocks. · Energy-driven inflation shifts focus to commodity inputs and macro hedges; monitor broader risk asset sensitivity as crude holds above the $100 psychological level.
Read the full story
Original reporting and related coverage — attribution links only, not paid recommendations.
Trade this story (crypto)
 Coinbase
 Gemini
 Robinhood
 Webull
Chart this story
 TradingView
Broker and exchange buttons use invite / refer-a-friend links (rewards may be capped). Charting links (TradingView) are partner offers that may pay OppHub America a commission at no extra cost to you.
OppSHOP
Full OppSHOP →As an Amazon Associate, OppHub America earns from qualifying purchases. Shopping here helps keep the site free — at no extra cost to you. Disclosure

OppSHOP
Related to this story
As economic prints and banking updates unfold, traders should monitor ra
Shop related →

Investing books
Read the classics
Shop this pick →

Personal finance books
Run the household books
Shop this pick →

Trading notebooks
Write the thesis first
Shop this pick →

Monitor for charts
See every pane
Shop this pick →
Story playbook
A pre-built map of what to watch — stocks, ETFs, and educational next steps. Not personalized advice.
Snapshot date: October 10, 2026 at 11:16 AM ET
This playbook was built when the story published and is not live-updated. Prices, news, and risk can change after this date — treat it as a starting map, not a current trade ticket.
Story → money map
Macro inflation and banking earnings
Big banks are reporting earnings and new inflation reports are coming out, which tells us how the overall economy is doing. People with money are watching these closely because they show whether interest rates might change and how businesses are holding up.
What changed
A heavy macroeconomic calendar featuring upcoming CPI data, retail sales, and central bank commentary has shifted market focus from tech momentum toward inflation and interest rate sensitivity.
Who wins / who loses
Diversified financial institutions and value sectors may benefit from shifting risk sentiment, while high-multiple technology stocks face headwinds from cooling momentum and sticky inflation expectations.
Time horizon
Think in terms of the next few weeks.
Confidence & best fit
medium confidence · Long-term investor, Active trader
Safer theme exposure (ETFs)
Baskets that own the theme without betting on one company.
Single stocks (higher risk)
Primary = closest to the story · Peers = same industry · Second-order = knock-on effects · Avoid = looks related but may be a trap
Primary
- $JPMWatch — track, don’t rush
Large banks give us a good look at how everyday consumers and businesses are handling their money.
View $JPM chart → · End-of-day delayed data
Peer
- $BACWatch — track, don’t rush
Another major bank that moves up or down based on interest rates and the health of the banking system.
View $BAC chart → · End-of-day delayed data
Second-order
- $TSMWatch — track, don’t rush
A key chipmaker that shows whether demand for advanced technology is staying strong.
View $TSM chart → · End-of-day delayed data
Options (education only)
No strikes or expiries — a framework for how traders might express the view. Options can expire worthless.
Beginners should skip options right now because surprise inflation news can make stock prices jump around unpredictably.
See options-friendly brokers →Income / OppHub America angle
Not a trade tip — ways to use the insight outside the market.
- Review cash yields and short-duration fixed income as interest rate expectations fluctuate.
What would break this thesis
- Significantly cooler-than-expected inflation prints that completely eliminate rate hike concerns.
What to do next on OppHub America
Saved playbooks stay on this device for now.
Important
Not financial advice. OppHub America playbooks are educational market maps only — not recommendations to buy, sell, or hold any security. Markets move fast; information can be wrong or outdated. Trade and invest at your own risk. Do your own research or consult a licensed advisor.
Aftermath · $NVDA
-4.03% vs write
- •Since this piece: $NVDA is down -4.03% vs $238.90 at write time (now $229.28).
- •Session move (Yahoo delayed): -0.52%.
- •RSI14 at write was 84.6 — compare levels on Markets, not advice.
- •Original money play lens: As economic prints and banking updates unfold, traders should monitor rate-sensitive sectors and financial bellwethers for shifts in monetary policy expectations.
- •Track $NVDA live on OppHub Markets (/markets/NVDA). Not financial advice.
Based on reporting from seeking-alpha.
Informational and educational only — not investment, financial, or legal advice. Disclosure
Shares a vertical MP4 loop to your phone's camera roll or app share sheet (Instagram, TikTok, Facebook Reels).