Barry, OppHub America Desk · · Source: yahoo-tickers-tape-movers
CPI Inflation Print: Consumer Prices Rise 0.4% MoM in October 2026
Tariffs & trade: Tariffs hit importers/retail and can lift domestic industrials; China ADRs sensitive.
Based on reporting from yahoo-tickers-tape-movers.
Consumer prices increased 0.4 percent on a seasonally adjusted basis and 3.4 percent over the last 12 months, according to government data released Wednesday, October 14, 2026. The print shapes Federal Reserve rate path expectations as markets gauge macroeconomic conditions.
Market context for this story
As of: PremarketLoading quotes…
Informational only — not investment advice. Full markets →


$SPYSPDR S&P 500 ETF
TradingView
Live chart & market data via TradingView · OppHub classroom · Delayed or exchange real-time per TradingView data agreements · Not investment advice
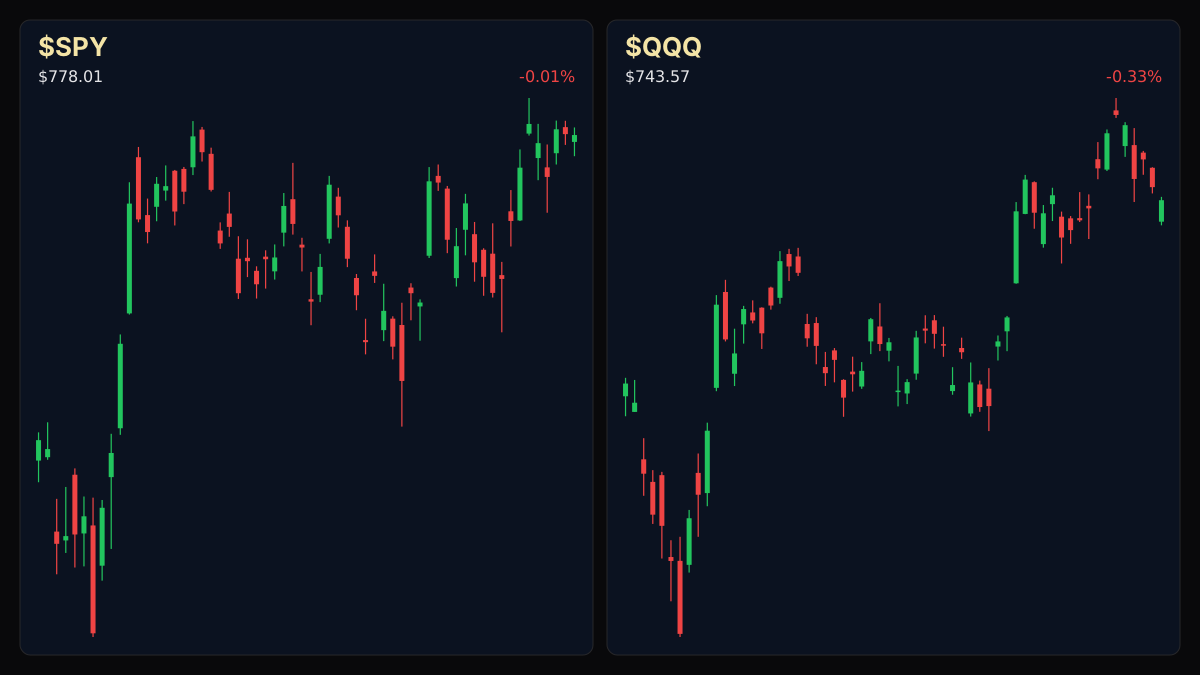
Educational TradingView chart — search any symbol in the widget. Confirm on /markets/SPY and related $QQQ. Not investment advice.
Related markets
Shares a vertical MP4 loop to your phone's camera roll or app share sheet (Instagram, TikTok, Facebook Reels).
Consumer prices increased 0.4 percent on a seasonally adjusted basis, matching a 3.4 percent annual increase over the last 12 months according to data released Wednesday, October 14, 2026. The CPI inflation report sets the tone for Federal Reserve policy deliberations.
### Money Play Market participants continue to assess macroeconomic data prints against broader asset class valuations and rate expectations.
### Executive Thesis The consumer price data underscores persistent inflationary pressures, keeping fixed-income markets sensitive to upcoming central bank communications. Traders are balancing the pace of economic activity against borrowing costs as key indices fluctuate.
### The Print - CPI-U increased 0.4 percent on a seasonally adjusted basis. - Over the last 12 months, the all items index increased 3.4 percent.
### Market Reaction Futures indicated a mixed opening ahead of the session, with S&P futures at 7,868.75 (+0.17%), Dow futures at 52,098.00 (+0.31%), and Nasdaq futures at 30,754.25 (-0.12%). The 10-year Treasury bond yield stood at 5.22 (-0.44%), while the VIX volatility index registered 15.35 (+0.52%). Gold traded at 4,162.40 (-0.36%) and Bitcoin stood at 83,428.45 (+0.21%).
### What It Means for Policy & Positioning The latest inflation metrics feed directly into the Federal Reserve's dual-mandate evaluation, influencing rate trajectory outlooks across institutional desks without assuming forward rate moves.
### Next Calendar Watch Watch upcoming central bank statements and incoming macroeconomic data releases for further validation of the rate path.
Read the full story
Original reporting and related coverage — attribution links only, not paid recommendations.
Trade this story
 Robinhood
 Webull
 Tradier
 IBKR
IBKR
Chart this story
 TradingView
Broker and exchange buttons use invite / refer-a-friend links (rewards may be capped). Charting links (TradingView) are partner offers that may pay OppHub America a commission at no extra cost to you.
OppSHOP
Full OppSHOP →As an Amazon Associate, OppHub America earns from qualifying purchases. Shopping here helps keep the site free — at no extra cost to you. Disclosure

OppSHOP
Related to this story
Tariffs & trade: Tariffs hit importers/retail and can lift domestic indu
Shop related →

Investing books
Read the classics
Shop this pick →

Personal finance books
Run the household books
Shop this pick →

Trading notebooks
Write the thesis first
Shop this pick →

Monitor for charts
See every pane
Shop this pick →
Story playbook
A pre-built map of what to watch — stocks, ETFs, and educational next steps. Not personalized advice.
Snapshot date: October 14, 2026 at 8:06 AM ET
This playbook was built when the story published and is not live-updated. Prices, news, and risk can change after this date — treat it as a starting map, not a current trade ticket.
Story → money map
macro inflation & rates
Inflation came in higher than some hoped, meaning everyday goods and borrowing costs remain pricey. Investors care because the Federal Reserve may keep interest rates elevated to cool the economy down.
What changed
October CPI inflation printed at 0.4 percent month-over-month, pushing the annual rate to 3.4 percent.
Who wins / who loses
Fixed-income and rate-sensitive sectors face headwinds from sticky yields, while broad diversified funds remain in a wait-and-see mode.
Time horizon
Think in terms of the next few weeks.
Confidence & best fit
medium confidence · Long-term investor, Active trader
Safer theme exposure (ETFs)
Baskets that own the theme without betting on one company.
Single stocks (higher risk)
Primary = closest to the story · Peers = same industry · Second-order = knock-on effects · Avoid = looks related but may be a trap
Primary
- $TLTWatch — track, don’t rush
Tracks long-term government bonds, which drop in value when inflation stays sticky.
View $TLT chart → · End-of-day delayed data
Peer
- $XLFWatch — track, don’t rush
A basket of big banks and financial companies that care deeply about interest rates.
View $XLF chart → · End-of-day delayed data
Second-order
- $XLUStay away — for now
Utility stocks often lose appeal to investors when safe government bonds pay high interest.
View $XLU chart → · End-of-day delayed data
- $GLDWatch — track, don’t rush
Tracks gold prices, which people often buy to protect wealth against rising inflation.
View $GLD chart → · End-of-day delayed data
Options (education only)
No strikes or expiries — a framework for how traders might express the view. Options can expire worthless.
Options are complicated when inflation data is mixed; beginners should sit this one out and stick to cash or broad funds.
See options-friendly brokers →Income / OppHub America angle
Not a trade tip — ways to use the insight outside the market.
- Locking in high-yield savings or short-term certificates of deposit while yields remain elevated.
What would break this thesis
- Subsequent inflation prints showing a sharp, unexpected cooling trend toward central bank targets.
What to do next on OppHub America
Saved playbooks stay on this device for now.
Important
Not financial advice. OppHub America playbooks are educational market maps only — not recommendations to buy, sell, or hold any security. Markets move fast; information can be wrong or outdated. Trade and invest at your own risk. Do your own research or consult a licensed advisor.
Based on reporting from yahoo-tickers-tape-movers.
Informational and educational only — not investment, financial, or legal advice. Disclosure
Shares a vertical MP4 loop to your phone's camera roll or app share sheet (Instagram, TikTok, Facebook Reels).