Barry, OppHub America Desk · · Source: fed-press
Federal Reserve Releases 2025 Survey of Consumer Finances
Path of rates dominates indexes, banks, credit, and duration assets.
Based on reporting from fed-press.
The Federal Reserve published its triennial Survey of Consumer Finances on Friday, October 9, 2026, detailing household income, assets, and debt trends from 2022 to 2025. Traders and financial institutions monitor this dataset to gauge consumer balance-sheet resilience amid evolving monetary policy.
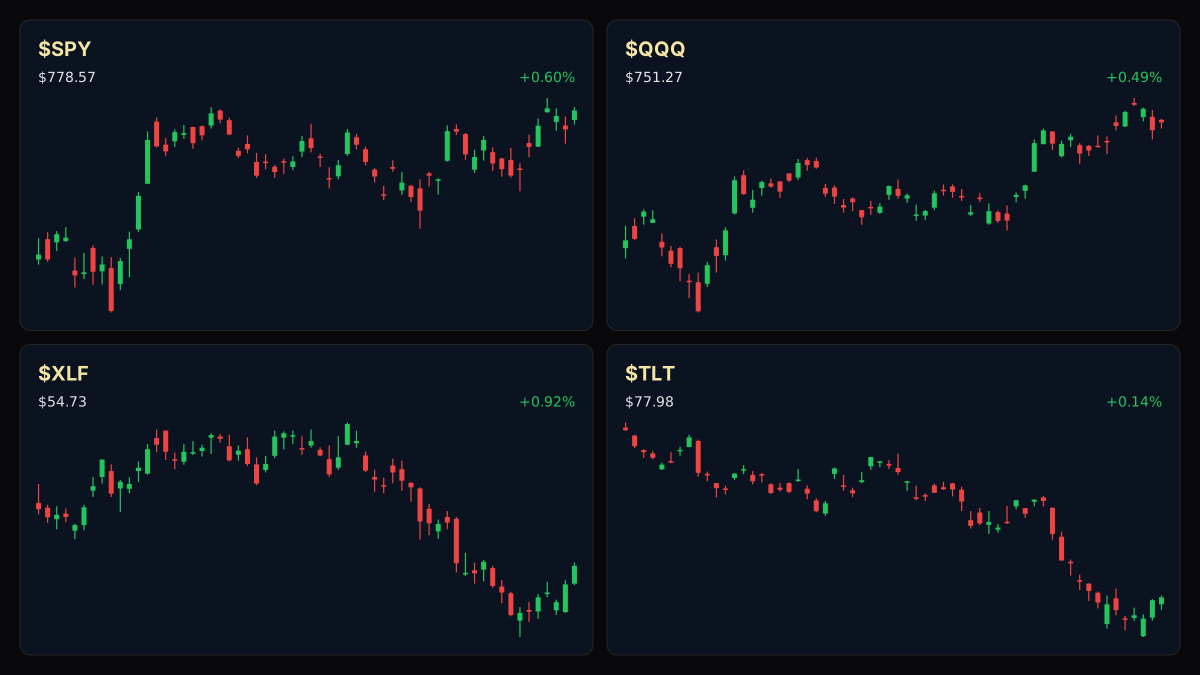
Market context for this story
As of: Regular HoursLoading quotes…
Informational only — not investment advice. Full markets →
 SPDR S&P 500 ETF·$SPY
 Invesco QQQ Trust·$QQQ
 iShares 20+ Year Treasury·$TLT
 Financial Select Sector·$XLF
$SPYSPDR S&P 500 ETF
TradingView
Live chart & market data via TradingView · OppHub classroom · Delayed or exchange real-time per TradingView data agreements · Not investment advice
$QQQInvesco QQQ Trust
TradingView
Live chart & market data via TradingView · OppHub classroom · Delayed or exchange real-time per TradingView data agreements · Not investment advice
Educational TradingView charts — search any symbol in the widget. Confirm on /markets/SPY and related $QQQ, $TLT, $XLF. Not investment advice.
Related markets
Shares a vertical MP4 loop to your phone's camera roll or app share sheet (Instagram, TikTok, Facebook Reels).
The Federal Reserve published its triennial Survey of Consumer Finances on Friday, October 9, 2026, offering detailed insights into U.S. family balance sheets, debt burdens, and wealth distribution.
### Money Play Path of rates dominates indexes, banks, credit, and duration assets. Monitor broader macroeconomic indicators as household survey data informs central bank policy.
### Executive Thesis The triennial survey, conducted since 1989 in partnership with NORC at the University of Chicago, provides institutional analysts with granular metrics on income, net worth, and borrowing behavior. Understanding these balance-sheet dynamics helps market participants assess consumer credit risk and discretionary spending capacity.
### The Print The summary report, titled Changes in U.S. Family Finances from 2022 to 2025, covers shifts in household assets, debt profiles, and financial vulnerability across randomly sampled metropolitan and rural areas nationwide.
### Market Reaction Broad market reaction to the triennial release remains muted as investors digest long-term structural shifts in household wealth alongside ongoing monetary policy expectations.
### What It Means for Policy & Positioning Detailed distribution data assists policymakers in evaluating the transmission of interest rate changes across different demographic segments and debt tiers.
### Next Calendar Watch Watch for subsequent academic and Federal Reserve research releases utilizing the 2025 survey data for deeper distributional analyses.
### Story Arc / How We Got Here This release follows prior macro and commodity tracking, including developments such as Brent Crude Above $100: Crypto Resilience Amid High Oil Prices (/explore/brent-crude-above-100-crypto-resilience-oil-prices), highlighting how persistent cost pressures interact with consumer financial health.
Read the full story
Original reporting and related coverage — attribution links only, not paid recommendations.
Trade this story
 Robinhood
 Webull
 Tradier
 IBKR
IBKR
Chart this story
 TradingView
Broker and exchange buttons use invite / refer-a-friend links (rewards may be capped). Charting links (TradingView) are partner offers that may pay OppHub America a commission at no extra cost to you.
OppSHOP
Full OppSHOP →As an Amazon Associate, OppHub America earns from qualifying purchases. Shopping here helps keep the site free — at no extra cost to you. Disclosure

OppSHOP
Related to this story
Path of rates dominates indexes, banks, credit, and duration assets.
Shop related →

Investing books
Read the classics
Shop this pick →

Personal finance books
Run the household books
Shop this pick →

Trading notebooks
Write the thesis first
Shop this pick →

Monitor for charts
See every pane
Shop this pick →
Story playbook
A pre-built map of what to watch — stocks, ETFs, and educational next steps. Not personalized advice.
Snapshot date: October 10, 2026 at 4:36 AM ET
This playbook was built when the story published and is not live-updated. Prices, news, and risk can change after this date — treat it as a starting map, not a current trade ticket.
Story → money map
consumer balance sheets and interest rate path
The government published a massive report on how much money everyday Americans have saved, earned, and borrowed over the last few years. Investors pay attention to this because healthy consumers keep the economy growing, which directly affects interest rates and stock prices.
What changed
The Federal Reserve published the 2025 Survey of Consumer Finances, offering fresh data on household balance sheets and debt burdens.
Who wins / who loses
Lenders with strong credit controls benefit from clear consumer debt data, while highly leveraged financial institutions and discretionary sectors face higher uncertainty as rate policy reacts.
Time horizon
Think in terms of the next few months.
Confidence & best fit
medium confidence · Long-term investor
Safer theme exposure (ETFs)
Baskets that own the theme without betting on one company.
Single stocks (higher risk)
Primary = closest to the story · Peers = same industry · Second-order = knock-on effects · Avoid = looks related but may be a trap
Primary
- $JPMWatch — track, don’t rush
Big banks need to know if everyday people are running out of money or struggling to pay their loans.
View $JPM chart → · End-of-day delayed data
Second-order
- $XLFWatch — track, don’t rush
This fund tracks banks and financial companies that care deeply about whether consumers can pay their debts.
View $XLF chart → · End-of-day delayed data
- $TLTWatch — track, don’t rush
Long-term bonds move up and down based on where interest rates are heading next.
View $TLT chart → · End-of-day delayed data
Options (education only)
No strikes or expiries — a framework for how traders might express the view. Options can expire worthless.
Beginners should skip options here since this is an informational data release rather than an earnings surprise, making price direction hard to predict.
See options-friendly brokers →Income / OppHub America angle
Not a trade tip — ways to use the insight outside the market.
- Monitor local banking credit standards and consumer loan demand in your community.
What would break this thesis
- Sudden shifts in inflation data overriding long-term consumer balance sheet trends.
What to do next on OppHub America
Saved playbooks stay on this device for now.
Important
Not financial advice. OppHub America playbooks are educational market maps only — not recommendations to buy, sell, or hold any security. Markets move fast; information can be wrong or outdated. Trade and invest at your own risk. Do your own research or consult a licensed advisor.
Based on reporting from fed-press.
Informational and educational only — not investment, financial, or legal advice. Disclosure
Shares a vertical MP4 loop to your phone's camera roll or app share sheet (Instagram, TikTok, Facebook Reels).