Barry, OppHub America Desk · · Source: yahoo-big4-etfs
Fidelity's Timmer: Stock Market Rally Driven by Earnings, Not Valuations
Scion / Burry disclosed positions → require 13F facts.
Based on reporting from yahoo-big4-etfs.
Fidelity's Jurrien Timmer argues the current stock market rally is primarily fueled by corporate earnings growth, a key differentiator from the dot-com bubble era. While valuations are elevated, the focus on earnings resilience provides a cushion, though any profit deceleration could expose the market's richness.
Market context for this story
As of: Regular HoursLoading quotes…
Informational only — not investment advice. Full markets →


$SPYSPDR S&P 500 ETF
TradingView
Live chart & market data via TradingView · OppHub classroom · Delayed or exchange real-time per TradingView data agreements · Not investment advice
$QQQInvesco QQQ Trust
TradingView
Live chart & market data via TradingView · OppHub classroom · Delayed or exchange real-time per TradingView data agreements · Not investment advice
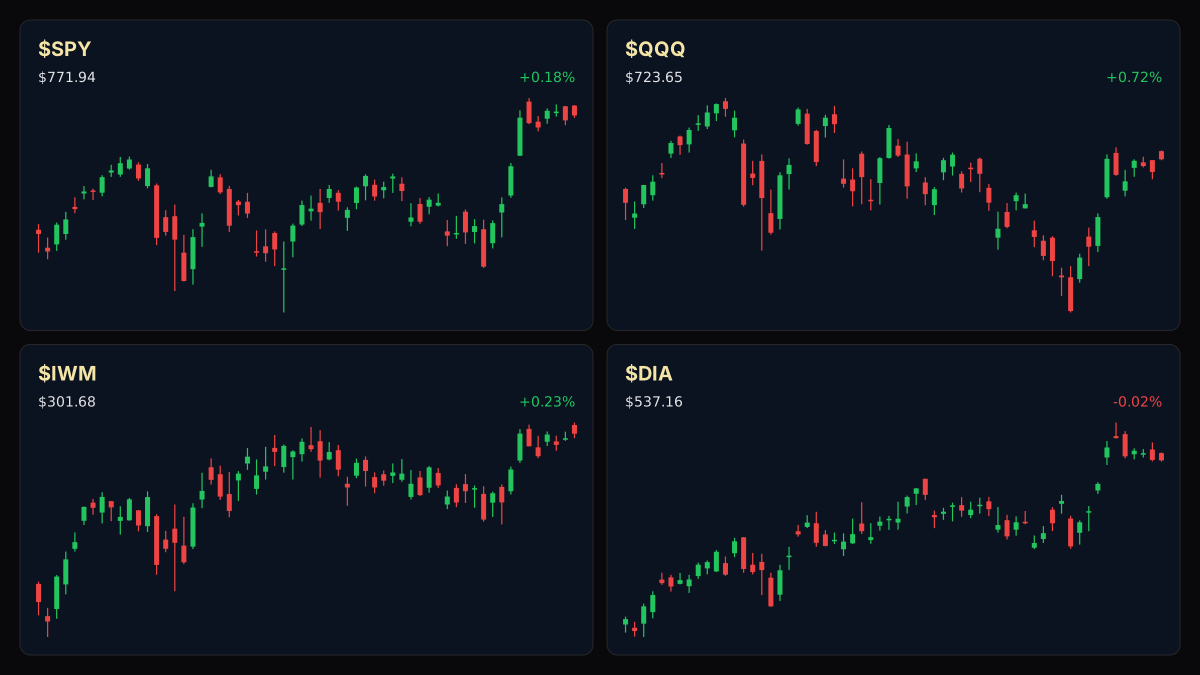
Educational TradingView charts — search any symbol in the widget. Confirm on /markets/SPY and related $QQQ, $DIA, $IWM. Not investment advice.
Related markets
Shares a vertical MP4 loop to your phone's camera roll or app share sheet (Instagram, TikTok, Facebook Reels).
Fidelity's Jurrien Timmer highlighted a key distinction in the current stock market rally compared to the dot-com bubble: earnings growth, rather than valuation expansion, is the primary driver. Data from Fidelity indicates five-year earnings-per-share growth is running at approximately 14% in 2026, while the five-year change in price-to-earnings ratios is negative 3%. This contrasts with 1999, when EPS growth was similar but valuation multiples also saw significant expansion.
Despite the focus on earnings, Timmer noted that the market is not cheap, with the S&P 500's cyclically adjusted price-to-earnings ratio approaching levels seen around the 2000 peak. S&P Dow Jones Indices data show the benchmark advanced over 21% in the 12 months leading up to August 10, 2026. Strong corporate fundamentals and capital spending have supported these gains.
Investors are advised to monitor forward EPS estimates, profit margins, and earnings revisions. Sustained profit growth is crucial for supporting elevated stock prices without further P/E multiple expansion. Conversely, a slowdown in earnings could quickly make current valuations appear precarious.
Read the full story
Original reporting and related coverage — attribution links only, not paid recommendations.
Trade this story
 Robinhood
 Webull
 Tradier
 IBKR
IBKR
Chart this story
 TradingView
Broker and exchange buttons use invite / refer-a-friend links (rewards may be capped). Charting links (TradingView) are partner offers that may pay OppHub America a commission at no extra cost to you.
OppSHOP
Full OppSHOP →As an Amazon Associate, OppHub America earns from qualifying purchases. Shopping here helps keep the site free — at no extra cost to you. Disclosure

OppSHOP
Related to this story
Scion / Burry disclosed positions → require 13F facts.
Shop related →

Investing books
Read the classics
Shop this pick →

Personal finance books
Run the household books
Shop this pick →

Trading notebooks
Write the thesis first
Shop this pick →

Monitor for charts
See every pane
Shop this pick →
Story playbook
A pre-built map of what to watch — stocks, ETFs, and educational next steps. Not personalized advice.
Snapshot date: August 12, 2026 at 11:26 AM ET
This playbook was built when the story published and is not live-updated. Prices, news, and risk can change after this date — treat it as a starting map, not a current trade ticket.
Story → money map
corporate earnings growth
Experts point out that the current stock market boom is supported by actual company profits rather than just hype, unlike the tech bubble in 1999. However, stocks are still expensive, so investors are watching closely to make sure companies keep making money.
What changed
Fidelity's analysis highlights that current five-year EPS growth is driving market gains, contrasting with 1999 multiple expansion.
Who wins / who loses
Strong corporate earners and broad market index funds benefit from fundamental resilience, while richly valued speculative stocks face downside risk if earnings slow.
Time horizon
Think in terms of the next few months.
Confidence & best fit
medium confidence · Long-term investor
Safer theme exposure (ETFs)
Baskets that own the theme without betting on one company.
Single stocks (higher risk)
Primary = closest to the story · Peers = same industry · Second-order = knock-on effects · Avoid = looks related but may be a trap
Primary
- $SPYBuild slowly — only if it fits your plan
A fund holding top U.S. companies that benefit when business profits stay strong.
View $SPY chart → · End-of-day delayed data
Peer
- $QQQWatch — track, don’t rush
A technology stock fund that needs high profits to justify its expensive price tags.
View $QQQ chart → · End-of-day delayed data
Second-order
- $DIAWatch — track, don’t rush
A basket of traditional industrial and blue-chip companies with steady profits.
View $DIA chart → · End-of-day delayed data
Avoid / trap
- $IWMProtect — reduce risk
Smaller companies that might struggle more if earnings growth slows down.
View $IWM chart → · End-of-day delayed data
Options (education only)
No strikes or expiries — a framework for how traders might express the view. Options can expire worthless.
Direction: volatile · Style: Protective put / downside hedge idea · Level: intermediate
Buying insurance against a market drop in case company earnings start to disappoint. Beginners should generally stick to holding diversified index funds.
Income / OppHub America angle
Not a trade tip — ways to use the insight outside the market.
- Review individual portfolio holdings to ensure earnings revisions remain positive.
What would break this thesis
- A broad deceleration in corporate earnings growth or a sudden spike in inflation leading to margin compression.
What to do next on OppHub America
Saved playbooks stay on this device for now.
Important
Not financial advice. OppHub America playbooks are educational market maps only — not recommendations to buy, sell, or hold any security. Markets move fast; information can be wrong or outdated. Trade and invest at your own risk. Do your own research or consult a licensed advisor.
Aftermath · $NVDA
+3.01% vs write
- •Since this piece: $NVDA is up +3.01% vs $217.55 at write time (now $224.09).
- •Session move (Yahoo delayed): +3.03%.
- •RSI14 at write was 57.5 — compare levels on Markets, not advice.
- •Original money play lens: Scion / Burry disclosed positions → require 13F facts.
- •Track $NVDA live on OppHub Markets (/markets/NVDA). Not financial advice.
Based on reporting from yahoo-big4-etfs.
Informational and educational only — not investment, financial, or legal advice. Disclosure
Shares a vertical MP4 loop to your phone's camera roll or app share sheet (Instagram, TikTok, Facebook Reels).