Barry, OppHub America Desk · · Source: oilprice-main
Energy Strategy Faces Tests as CPI-U Rises 0.6% MoM
Monitor energy input transmission into broader price indices as diesel averages $6.28 a gallon and Brent holds above $100.
Based on reporting from oilprice-main.
Consumer inflation prints higher with CPI-U increasing 0.6% MoM and 3.7% YoY as energy risk converges on upcoming deadlines. Washington navigates Gulf security decisions and looming duties of up to 500% on Russian petroleum products under General License 135 running until April 7, 2027.
Market context for this story
As of: After HoursLoading quotes…
Informational only — not investment advice. Full markets →
 SPDR S&P 500 ETF·$SPY
 Invesco QQQ Trust·$QQQ
 iShares 20+ Year Treasury·$TLT
 Financial Select Sector·$XLF
$SPYSPDR S&P 500 ETF
TradingView
Live chart & market data via TradingView · OppHub classroom · Delayed or exchange real-time per TradingView data agreements · Not investment advice
$QQQInvesco QQQ Trust
TradingView
Live chart & market data via TradingView · OppHub classroom · Delayed or exchange real-time per TradingView data agreements · Not investment advice
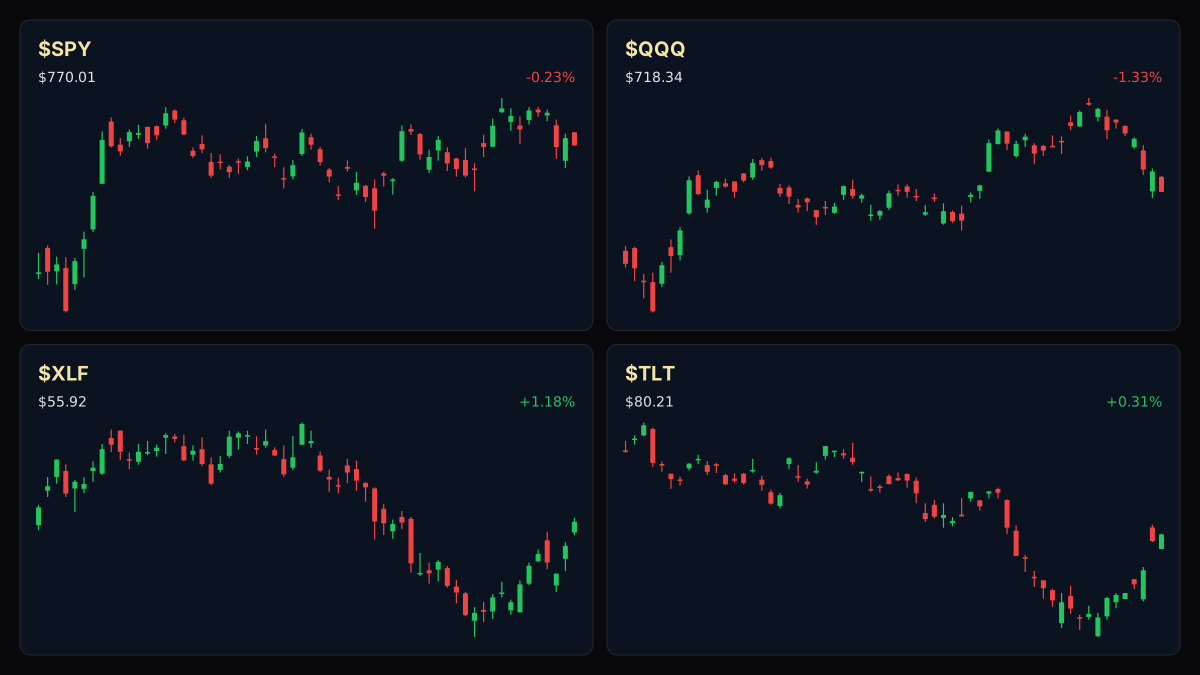
Educational TradingView charts — search any symbol in the widget. Confirm on /markets/SPY and related $QQQ, $TLT, $XLF. Not investment advice.
Related markets
Shares a vertical MP4 loop to your phone's camera roll or app share sheet (Instagram, TikTok, Facebook Reels).
Consumer price inflation accelerated as the Consumer Price Index for All Urban Consumers (CPI-U) increased 0.6 percent on a seasonally adjusted basis, with the 12-month all items index rising 3.7 percent.
### Money Play Market participants tracking macroeconomic inflation prints should observe how energy input costs influence broader price stability without relying on generic sector ETFs.
### Executive Thesis The latest Consumer Price Index print underscores persistent inflationary pressures driven by energy dynamics, including refined product benchmarks where diesel averages $6.28 a gallon and Brent sits above $100. Policymakers face compounding tests in managing domestic fuel prices against geopolitical friction in the Gulf and upcoming sanctions deadlines.
### The Print - CPI-U increased 0.6 percent on a seasonally adjusted basis MoM. - The all items index increased 3.7 percent over the last 12 months.
### Market Reaction Wholesale diesel prices remained steady while retail averages stood at $6.28 a gallon, alongside Brent crude holding above $100.
### What It Means for Policy & Positioning With Citi anticipating a December rate increase by the Federal Reserve and inflation running at 3.7% YoY, monetary policy deliberations remain sensitive to energy market volatility and potential supply disruptions.
### Next Calendar Watch General License 135 remains active until the April 7, 2027 deadline, while upcoming weekend energy decisions test U.S. pump price strategies.
Read the full story
Original reporting and related coverage — attribution links only, not paid recommendations.
Trade this story
 Robinhood
 Webull
 Tradier
 IBKR
IBKR
Chart this story
 TradingView
Broker and exchange buttons use invite / refer-a-friend links (rewards may be capped). Charting links (TradingView) are partner offers that may pay OppHub America a commission at no extra cost to you.
OppSHOP
Full OppSHOP →As an Amazon Associate, OppHub America earns from qualifying purchases. Shopping here helps keep the site free — at no extra cost to you. Disclosure

OppSHOP
Related to this story
Monitor energy input transmission into broader price indices as diesel a
Shop related →

Investing books
Read the classics
Shop this pick →

Personal finance books
Run the household books
Shop this pick →

Trading notebooks
Write the thesis first
Shop this pick →

Monitor for charts
See every pane
Shop this pick →
Story playbook
A pre-built map of what to watch — stocks, ETFs, and educational next steps. Not personalized advice.
Snapshot date: October 16, 2026 at 11:08 AM ET
This playbook was built when the story published and is not live-updated. Prices, news, and risk can change after this date — treat it as a starting map, not a current trade ticket.
Story → money map
oil supply and inflation
Prices for everyday goods jumped higher because energy costs like gasoline and diesel are staying very expensive. Investors care about this because high energy costs can force the Federal Reserve to raise interest rates to slow the economy down.
What changed
CPI-U rose 0.6 percent on a monthly basis, fueled by high energy inputs.
Who wins / who loses
Traditional energy producers and refiners benefit from high commodity prices, while consumers and cost-sensitive transport sectors are hurt.
Time horizon
Think in terms of the next few weeks.
Confidence & best fit
medium confidence · Active trader
Safer theme exposure (ETFs)
Baskets that own the theme without betting on one company.
Single stocks (higher risk)
Primary = closest to the story · Peers = same industry · Second-order = knock-on effects · Avoid = looks related but may be a trap
Primary
- $XLEBuild slowly — only if it fits your plan
An exchange-traded fund holding major oil and energy companies that profit when oil and fuel prices stay high.
View $XLE chart → · End-of-day delayed data
- $USOWatch — track, don’t rush
A fund that tracks the daily price movements of crude oil.
View $USO chart → · End-of-day delayed data
Peer
- $XOPWatch — track, don’t rush
A basket of companies that drill for oil and gas, doing well when energy prices climb.
Second-order
- $JETSStay away — for now
An airline industry fund that struggles when fuel costs get too expensive.
Options (education only)
No strikes or expiries — a framework for how traders might express the view. Options can expire worthless.
Direction: volatile · Style: Protective put / downside hedge idea · Level: intermediate
Beginners should skip options here, as predicting exact inflation reactions and energy swings is risky and complex.
Income / OppHub America angle
Not a trade tip — ways to use the insight outside the market.
- Focus on fuel-efficient logistics providers or localized supply chain alternatives to mitigate high diesel transport costs.
What would break this thesis
- A sharp unexpected drop in Brent crude below key technical levels or a cooling monthly CPI print.
What to do next on OppHub America
Saved playbooks stay on this device for now.
Important
Not financial advice. OppHub America playbooks are educational market maps only — not recommendations to buy, sell, or hold any security. Markets move fast; information can be wrong or outdated. Trade and invest at your own risk. Do your own research or consult a licensed advisor.
Based on reporting from oilprice-main.
Informational and educational only — not investment, financial, or legal advice. Disclosure
Shares a vertical MP4 loop to your phone's camera roll or app share sheet (Instagram, TikTok, Facebook Reels).