Barry, OppHub America Desk · · Source: yahoo-tickers-tape-movers
Interactive Brokers (IBKR) Stock Dividend Increase & Valuation
If Interactive Brokers maintains its compound growth trajectory and fast-growing payout profile, watch the 0.8% yield baseline and historical 23% 15-year return average because income-focused market participants often re-evaluate capital allocation when dividend growth outpaces baseline yields.
Based on reporting from yahoo-tickers-tape-movers.
Interactive Brokers Group (NASDAQ: IBKR) announced a 71.4% dividend increase, prompting a fresh look from market participants examining historical compound returns. Investors evaluating the payout expansion must weigh the near-term yield profile against long-term historical performance on Sunday, November 15, 2026. The platform's distribution move arrives as broader equity indexes navigate weekend tape adjustments.
Market context for this story
As of: WeekendLoading quotes…
Informational only — not investment advice. Full markets →


$IBKRInteractive Brokers
TradingView
Live chart & market data via TradingView · OppHub classroom · Delayed or exchange real-time per TradingView data agreements · Not investment advice
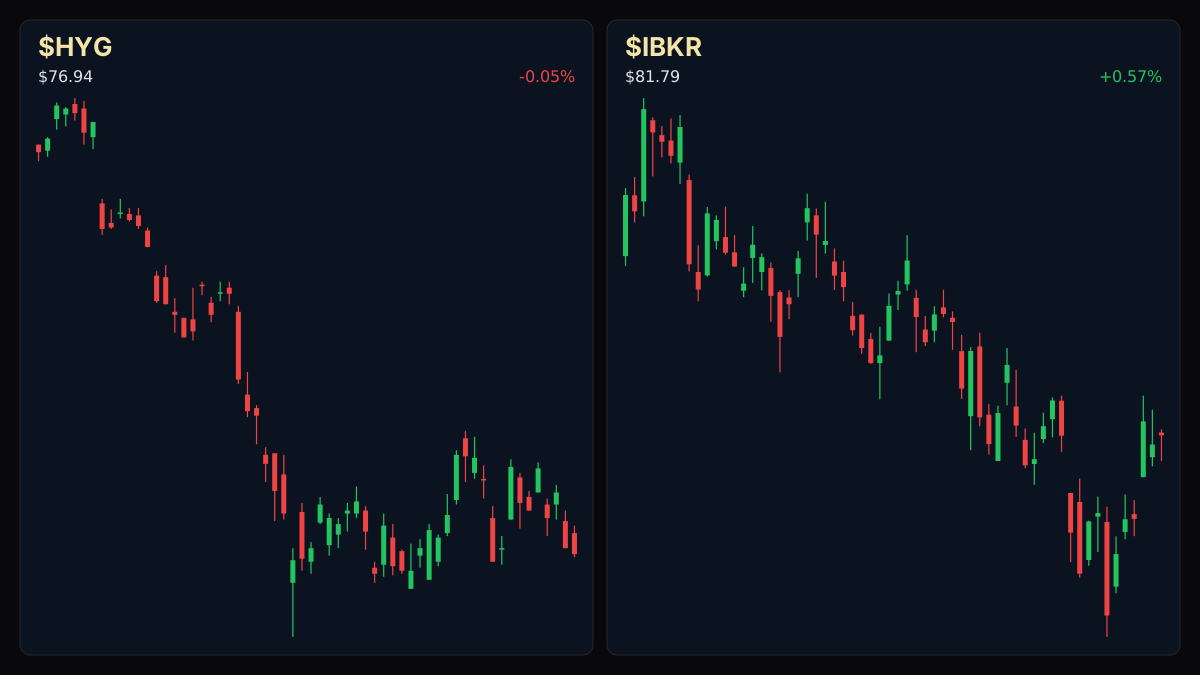
Educational TradingView chart — search any symbol in the widget. Confirm on /markets/IBKR and related $HYG. Not investment advice.
Related markets
Shares a vertical MP4 loop to your phone's camera roll or app share sheet (Instagram, TikTok, Facebook Reels).
### Session Tape — Interactive Brokers Group ($IBKR+WL) Interactive Brokers Group ($IBKR+WL) drew attention following an announced dividend increase of 71.4%, moving the quarterly payout from $0.0875 per share to a higher rate, while historical metrics reflect multi-year compounding.
## Catalyst Analysis: Payout Expansion and Historical Yield Familiar market participants following Interactive Brokers (NASDAQ: IBKR +0.57%) noted the substantial dividend adjustment alongside its baseline yield context. The firm's quarterly distribution shift from $0.0875 per share represents a 71.4% expansion, though the trailing dividend yield recently hovered near 0.8%. Long-term equity studies show the vehicle has averaged annual gains of nearly 23% over the past 15 years, positioning capital allocation strategies around compounding growth rather than immediate income generation alone.
## $IBKR+WL Technical Analysis & Key Risk Watch — Weekend Perspective
With the broader market resting ahead of the upcoming session, $IBKR+WL market participants continue to balance dividend-growth momentum against valuation multiples and volume participation. Key risk parameters center on whether accelerated payouts can sustain multiple expansion in a shifting interest rate landscape.
### Money Play - If Interactive Brokers ($IBKR+WL) maintains its compound growth trajectory and fast-growing payout profile, watch the 0.8% yield baseline and historical 23% 15-year return average because income-focused market participants often re-evaluate capital allocation when dividend growth outpaces baseline yields.
Read the full story
Original reporting and related coverage — attribution links only, not paid recommendations.
Trade this story
 Robinhood
 Webull
 Tradier
 IBKR
Chart this story
 TradingView
Broker and exchange buttons use invite / refer-a-friend links (rewards may be capped). Charting links (TradingView) are partner offers that may pay OppHub America a commission at no extra cost to you.
OppSHOP
Full OppSHOP →As an Amazon Associate, OppHub America earns from qualifying purchases. Shopping here helps keep the site free — at no extra cost to you. Disclosure

OppSHOP
Related to this story
If Interactive Brokers maintains its compound growth trajectory and fast
Shop related →

Investing books
Read the classics
Shop this pick →

Personal finance books
Run the household books
Shop this pick →

Trading notebooks
Write the thesis first
Shop this pick →

Monitor for charts
See every pane
Shop this pick →
Story playbook
A pre-built map of what to watch — stocks, ETFs, and educational next steps. Not personalized advice.
Snapshot date: November 15, 2026 at 3:25 PM ET
This playbook was built when the story published and is not live-updated. Prices, news, and risk can change after this date — treat it as a starting map, not a current trade ticket.
Story → money map
brokerage dividend growth
Interactive Brokers just raised its regular dividend payment by a huge 71.4%. People who invest money are paying attention because while the starting cash payout is still relatively small, the company has a history of growing its wealth impressively over many years.
What changed
Interactive Brokers announced a 71.4% increase to its quarterly dividend payout.
Who wins / who loses
Long-term shareholders and dividend-growth investors benefit from higher cash returns, while immediate income-focused investors may find the baseline yield still too low.
Time horizon
Think in terms of the next few months.
Confidence & best fit
medium confidence · Long-term investor, Active trader
Safer theme exposure (ETFs)
Baskets that own the theme without betting on one company.
Single stocks (higher risk)
Primary = closest to the story · Peers = same industry · Second-order = knock-on effects · Avoid = looks related but may be a trap
Primary
- $IBKRWatch — track, don’t rush
The company is paying out more cash to shareholders, but investors need to check if the stock price is too high for what it earns.
View $IBKR chart → · End-of-day delayed data
Peer
- $SCHWWatch — track, don’t rush
Other major online brokerage companies will be compared to this dividend move by investors.
View $SCHW chart → · End-of-day delayed data
- $HOODWatch — track, don’t rush
Trading apps popular with everyday people are watched to see how they return money to shareholders.
View $HOOD chart → · End-of-day delayed data
Options (education only)
No strikes or expiries — a framework for how traders might express the view. Options can expire worthless.
Direction: bullish · Style: Covered-call income (only if you already own shares) · Level: intermediate
Beginners should skip options; this is a way for advanced stock owners to make a little extra cash by agreeing to possibly sell their shares later if the price jumps high.
Income / OppHub America angle
Not a trade tip — ways to use the insight outside the market.
- Re-evaluating brokerage account cash sweep yields versus dividend-paying financial equities
What would break this thesis
- Broader market downturn or regulatory pressures reducing brokerage trading volumes and earnings growth
What to do next on OppHub America
Saved playbooks stay on this device for now.
Important
Not financial advice. OppHub America playbooks are educational market maps only — not recommendations to buy, sell, or hold any security. Markets move fast; information can be wrong or outdated. Trade and invest at your own risk. Do your own research or consult a licensed advisor.
Based on reporting from yahoo-tickers-tape-movers.
Informational and educational only — not investment, financial, or legal advice. Disclosure
Shares a vertical MP4 loop to your phone's camera roll or app share sheet (Instagram, TikTok, Facebook Reels).