Barry, OppHub America Desk · · Source: yahoo-megacap-tickers
Dimon Warns on Hidden Leverage as Markets Stretch
Investors are watching closely for signs of market stress that could be amplified by leveraged positions. While
Based on reporting from yahoo-megacap-tickers.
JPMorgan Chase CEO Jamie Dimon cautioned investors about elevated market leverage not fully captured by reported figures. Historical data suggests rapid increases in hidden debt can precede market downturns. Dimon highlighted that margin debt is at record levels, with a significant portion potentially obscured from standard reporting. He drew parallels to the dot-com bubble and the 2007 market peak, both preceded by periods of substantial margin debt accumulation. Concerns stem from potential cascading sell-offs if leveraged positions are liquidated rapidly during market stress.
Market context for this story
As of: After HoursLoading quotes…
Informational only — not investment advice. Full markets →
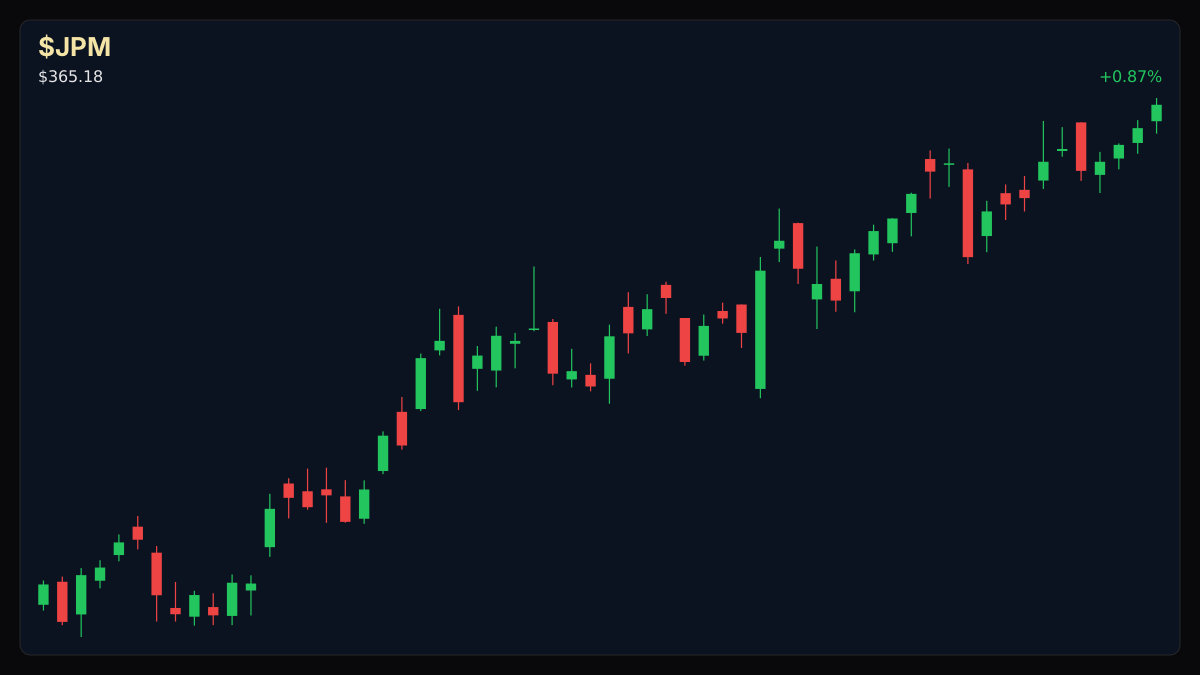
 $JPM
$JPM$JPM
TradingView
Live chart & market data via TradingView · OppHub classroom · Delayed or exchange real-time per TradingView data agreements · Not investment advice
Educational TradingView chart — search any symbol in the widget. Confirm on /markets/JPM. Not investment advice.
Related markets
Shares a vertical MP4 loop to your phone's camera roll or app share sheet (Instagram, TikTok, Facebook Reels).
JPMorgan Chase CEO Jamie Dimon issued a stark warning regarding hidden leverage in the stock market, suggesting that current valuations are stretched and vulnerable. Dimon stated that margin debt is at its highest level ever, with an estimated $1.5 trillion in June, a 49% year-over-year increase. He emphasized that this figure does not account for all forms of leverage, such as prime brokerage debt and leveraged ETFs, implying actual market leverage is considerably higher.
Historically, rapid increases in margin debt have preceded significant market downturns. Dimon cited three specific periods: December 1999, when margin debt rose over 60% and was followed by the dot-com bubble burst; May 2007, with a 50% increase in debt leading up to the 2008 financial crisis; and February 2021, a 49% rise preceding the January 2022 bear market.
The concern is that substantial, unmeasured leverage could exacerbate market volatility, leading to forced selling and a cascading effect on prices if conditions deteriorate. Investors are advised to monitor the potential impact of these leveraged positions on overall market stability.
Read the full story
Original reporting and related coverage — attribution links only, not paid recommendations.
Trade this story
 Robinhood
 Webull
 Tradier
 IBKR
IBKR
Chart this story
 TradingView
Broker and exchange buttons use invite / refer-a-friend links (rewards may be capped). Charting links (TradingView) are partner offers that may pay OppHub America a commission at no extra cost to you.
OppSHOP
Full OppSHOP →As an Amazon Associate, OppHub America earns from qualifying purchases. Shopping here helps keep the site free — at no extra cost to you. Disclosure

OppSHOP
Related to this story
Investors are watching closely for signs of market stress that could be
Shop related →

Investing books
Read the classics
Shop this pick →

Personal finance books
Run the household books
Shop this pick →

Trading notebooks
Write the thesis first
Shop this pick →

Monitor for charts
See every pane
Shop this pick →
Story playbook
A pre-built map of what to watch — stocks, ETFs, and educational next steps. Not personalized advice.
Snapshot date: August 12, 2026 at 11:40 PM ET
This playbook was built when the story published and is not live-updated. Prices, news, and risk can change after this date — treat it as a starting map, not a current trade ticket.
Story → money map
market leverage risk
JPMorgan's boss warned that people are borrowing too much money to buy stocks, which could cause a sudden market crash if prices start falling. Financial experts care because hidden debts can make a normal drop turn into a massive panic.
What changed
Jamie Dimon highlighted record margin debt and hidden leverage that could trigger forced selling during a market correction.
Who wins / who loses
Hedged portfolios and cash-heavy investors benefit from stability, while highly leveraged traders and speculative equities are hurt.
Time horizon
Think in terms of the next few months.
Confidence & best fit
medium confidence · Long-term investor
Safer theme exposure (ETFs)
Baskets that own the theme without betting on one company.
Single stocks (higher risk)
Primary = closest to the story · Peers = same industry · Second-order = knock-on effects · Avoid = looks related but may be a trap
Primary
- $JPMWatch — track, don’t rush
As a giant bank, JPMorgan watches out for risky loans and market crashes.
View $JPM chart → · End-of-day delayed data
Peer
- $XLFProtect — reduce risk
The financial sector ETF helps track overall banking health and worry levels.
View $XLF chart → · End-of-day delayed data
Options (education only)
No strikes or expiries — a framework for how traders might express the view. Options can expire worthless.
Direction: volatile · Style: Protective put / downside hedge idea · Level: intermediate
Think of buying market insurance: you pay a small fee now so that if the market crashes, you get a payout. Beginners should skip this and focus on holding cash.
Income / OppHub America angle
Not a trade tip — ways to use the insight outside the market.
- Review personal borrowing levels and maintain adequate cash reserves to avoid forced selling.
What would break this thesis
- Continued steady market expansion with low volatility and a significant reduction in reported margin debt.
What to do next on OppHub America
Saved playbooks stay on this device for now.
Important
Not financial advice. OppHub America playbooks are educational market maps only — not recommendations to buy, sell, or hold any security. Markets move fast; information can be wrong or outdated. Trade and invest at your own risk. Do your own research or consult a licensed advisor.
Based on reporting from yahoo-megacap-tickers.
Informational and educational only — not investment, financial, or legal advice. Disclosure
Shares a vertical MP4 loop to your phone's camera roll or app share sheet (Instagram, TikTok, Facebook Reels).