Barry, OppHub America Desk · · Source: yahoo-tickers-tape-movers
Nasdaq Recovers After 700-Point Drop as Firms Eye 2026 Midterms
Defense spending: Budget and contract news often move primes, software peers, and defense ETFs.
Based on reporting from yahoo-tickers-tape-movers.
Major Wall Street projections suggest the recent tech sell-off and 700-point Nasdaq correction could stabilize following the 2026 midterms. Amid shifting AI spending sentiment, broader major indices closed mixed on absolute sessions.
Market context for this story
As of: After HoursLoading quotes…
Informational only — not investment advice. Full markets →


$SPYSPDR S&P 500 ETF
TradingView
Live chart & market data via TradingView · OppHub classroom · Delayed or exchange real-time per TradingView data agreements · Not investment advice
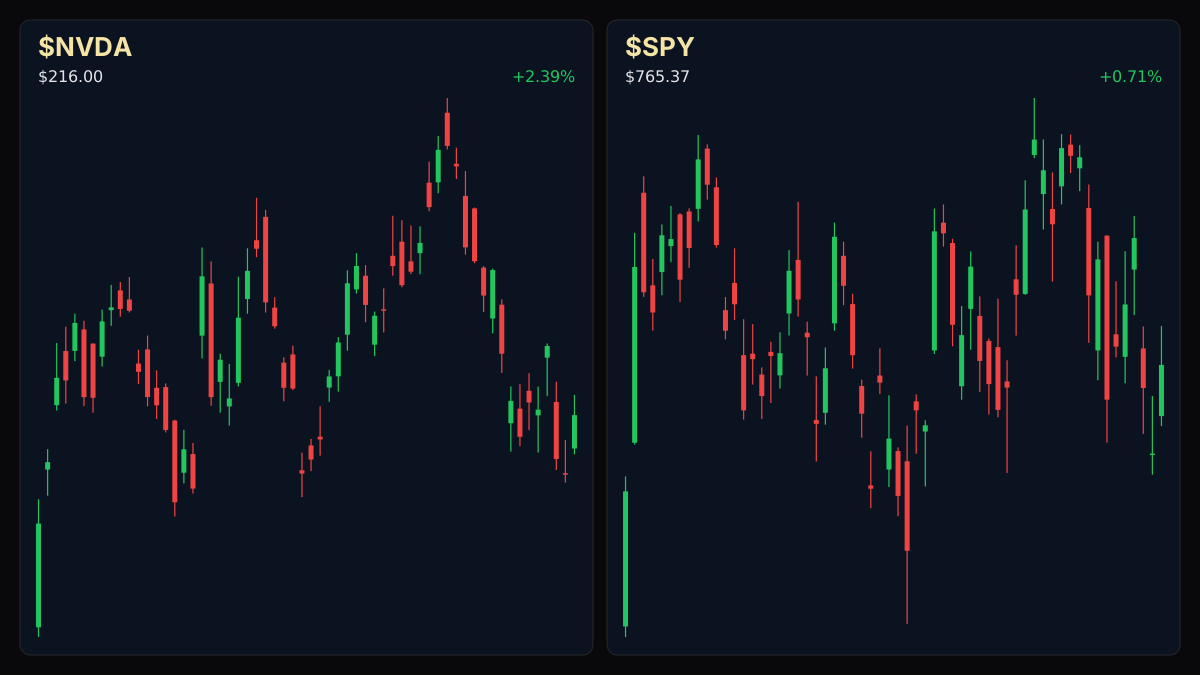
Educational TradingView chart — search any symbol in the widget. Confirm on /markets/SPY and related $NVDA. Not investment advice.
Related markets
Shares a vertical MP4 loop to your phone's camera roll or app share sheet (Instagram, TikTok, Facebook Reels).
Major Wall Street projections suggest the recent tech sell-off and 700-point Nasdaq correction could stabilize following the 2026 midterms. Amid shifting AI spending sentiment, broader major indices closed mixed on absolute sessions.
### Money Play Traders navigating broader equity volatility should evaluate index-level risk parameters carefully.
### Executive Thesis Recent sharp drawdowns across technology benchmarks highlight acute sensitivity to artificial intelligence expenditure cycles. Wall Street forecasting models increasingly point toward structural stabilization post-2026 midterms as sector sentiment adjusts to evolving capital expenditure realities.
### The Print Recent market data highlights the S&P 500 closing at 7,690.40, up 0.07%, while the Dow Jones Industrial Average finished at 52,380.00, advancing 0.02%. Meanwhile, the Nasdaq 100 settled at 29,365.30, gaining 0.14%, and the Russell 2000 closed at 2,788.09, higher by 0.07%.
### Market Reaction Equities have exhibited heightened intraday volatility, underscored by sharp single-session declines in growth-heavy indices before staging selective intraday recoveries.
### What It Means for Policy & Positioning Shifts in capital allocation toward artificial intelligence infrastructure continue to drive sector-specific rotation. Market participants are monitoring macroeconomic cues and political milestones as secondary indicators for shifting risk appetites.
### Next Calendar Watch Observers continue tracking upcoming macroeconomic prints and political calendar milestones leading toward the 2026 midterm elections.
Read the full story
Original reporting and related coverage — attribution links only, not paid recommendations.
Trade this story
 Robinhood
 Webull
 Tradier
 IBKR
Chart this story
 TradingView
Broker and exchange buttons use invite / refer-a-friend links (rewards may be capped). Charting links (TradingView) are partner offers that may pay OppHub America a commission at no extra cost to you.
OppSHOP
Full OppSHOP →As an Amazon Associate, OppHub America earns from qualifying purchases. Shopping here helps keep the site free — at no extra cost to you. Disclosure

OppSHOP
Related to this story
Defense spending: Budget and contract news often move primes, software p
Shop related →

Investing books
Read the classics
Shop this pick →

Personal finance books
Run the household books
Shop this pick →

Trading notebooks
Write the thesis first
Shop this pick →

Monitor for charts
See every pane
Shop this pick →
Story playbook
A pre-built map of what to watch — stocks, ETFs, and educational next steps. Not personalized advice.
Snapshot date: October 26, 2026 at 7:02 PM ET
This playbook was built when the story published and is not live-updated. Prices, news, and risk can change after this date — treat it as a starting map, not a current trade ticket.
Story → money map
Tech Volatility and AI Spending
Tech stocks bounced back after a sudden drop caused by worries over how much companies are spending on artificial intelligence. People with money in the market are watching closely to see if tech prices will stay bumpy or settle down over the next couple of years.
What changed
A sharp tech sell-off and subsequent recovery triggered renewed debate over AI capital expenditure cycles and political timelines affecting market stability.
Who wins / who loses
High-growth tech companies experience heightened volatility, while diversified index funds benefit from capital rotation into broader sectors.
Time horizon
Think in terms of the next few weeks.
Confidence & best fit
low confidence · Long-term investor, Active trader
Low confidence → prefer ETFs and “Watch,” not rushing into one stock.
Safer theme exposure (ETFs)
Baskets that own the theme without betting on one company.
Single stocks (higher risk)
Primary = closest to the story · Peers = same industry · Second-order = knock-on effects · Avoid = looks related but may be a trap
Primary
- $QQQWatch — track, don’t rush
This fund follows the big tech stocks that went on a wild rollercoaster ride.
View $QQQ chart → · End-of-day delayed data
Peer
- $SPYWatch — track, don’t rush
This fund represents the overall stock market so you can see how everyone else is doing.
View $SPY chart → · End-of-day delayed data
Options (education only)
No strikes or expiries — a framework for how traders might express the view. Options can expire worthless.
Beginners should skip options right now because the market is bouncing around too unpredictably.
See options-friendly brokers →Income / OppHub America angle
Not a trade tip — ways to use the insight outside the market.
- Focus on building cash reserves while waiting for clearer market direction.
What would break this thesis
- A sustained break below recent market lows or unexpected macroeconomic shocks that accelerate the tech sell-off.
What to do next on OppHub America
Saved playbooks stay on this device for now.
Important
Not financial advice. OppHub America playbooks are educational market maps only — not recommendations to buy, sell, or hold any security. Markets move fast; information can be wrong or outdated. Trade and invest at your own risk. Do your own research or consult a licensed advisor.
Based on reporting from yahoo-tickers-tape-movers.
Informational and educational only — not investment, financial, or legal advice. Disclosure
Shares a vertical MP4 loop to your phone's camera roll or app share sheet (Instagram, TikTok, Facebook Reels).