Barry, OppHub America Desk · · Source: yahoo-tickers-tape-movers
Buffett Indicator Hits 234% as S&P 500 Posts Historic Gains
Portfolio valuation extremes call for close monitoring of equity beta and risk exposure as historical market gauges reach record highs.
Based on reporting from yahoo-tickers-tape-movers.
The widely followed Buffett indicator has surged to 234%, signaling potential overvaluation as the S&P 500 index (^GSPC) delivers a 322% total return over the past decade. Investors are weighing historical valuation extremes against Federal Reserve monetary policy shifts that have expanded nominal economic value over the last two decades.
Market context for this story
As of: Regular HoursLoading quotes…
Informational only — not investment advice. Full markets →

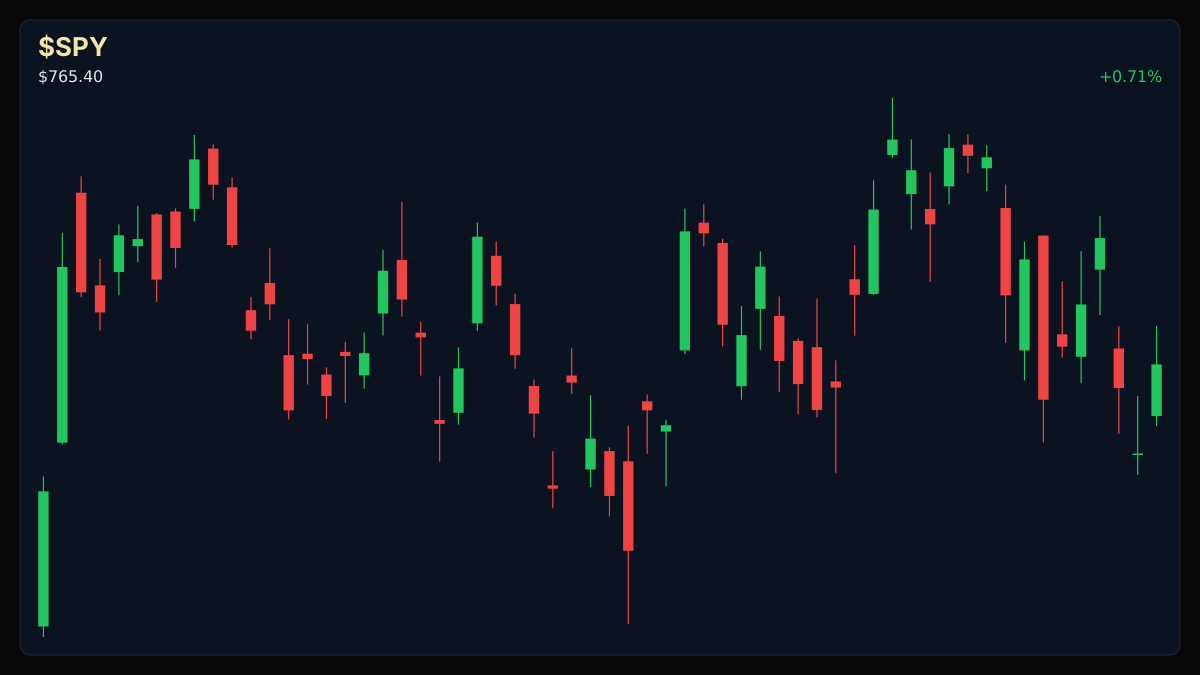
$SPYSPDR S&P 500 ETF
TradingView
Live chart & market data via TradingView · OppHub classroom · Delayed or exchange real-time per TradingView data agreements · Not investment advice
Educational TradingView chart — search any symbol in the widget. Confirm on /markets/SPY. Not investment advice.
Related markets
Shares a vertical MP4 loop to your phone's camera roll or app share sheet (Instagram, TikTok, Facebook Reels).
### Session Tape — S&P 500 +0.66%
## Catalyst Analysis: Valuation Metrics at Record Highs The Buffett indicator—calculated by dividing total U.S. stock market capitalization by U.S. gross domestic product—has climbed to an all-time reading of 234%. Originally framed by Warren Buffett in 2001, historical interpretations treat readings above 120% as a signal of expensive market pricing relative to underlying economic output.
Over the past two decades, total market value has expanded from $6.9 trillion to $23.3 trillion, propelled in part by Federal Reserve monetary policy and a ten-year annualized S&P 500 return of roughly 15%, outpacing its historical yearly average of 10%. By comparison, during previous market cycles, the metric hovered near 135%.
### Money Play Market valuation extremes require disciplined risk management and asset allocation review as macro liquidity conditions evolve. Investors should monitor portfolio duration and equity beta when historical valuation gauges signal extended levels.
Read the full story
Original reporting and related coverage — attribution links only, not paid recommendations.
Trade this story
 Robinhood
 Webull
 Tradier
 IBKR
Chart this story
 TradingView
Broker and exchange buttons use invite / refer-a-friend links (rewards may be capped). Charting links (TradingView) are partner offers that may pay OppHub America a commission at no extra cost to you.
OppSHOP
Full OppSHOP →As an Amazon Associate, OppHub America earns from qualifying purchases. Shopping here helps keep the site free — at no extra cost to you. Disclosure

OppSHOP
Related to this story
Portfolio valuation extremes call for close monitoring of equity beta an
Shop related →

Investing books
Read the classics
Shop this pick →

Personal finance books
Run the household books
Shop this pick →

Trading notebooks
Write the thesis first
Shop this pick →

Monitor for charts
See every pane
Shop this pick →
Story playbook
A pre-built map of what to watch — stocks, ETFs, and educational next steps. Not personalized advice.
Snapshot date: October 26, 2026 at 3:27 PM ET
This playbook was built when the story published and is not live-updated. Prices, news, and risk can change after this date — treat it as a starting map, not a current trade ticket.
Story → money map
market valuation extremes
A famous stock market gauge comparing total company values to the entire U.S. economy has hit a record high of 234%, suggesting stocks might be very expensive. People who manage money care about this because it often warns that a market pullback or lower future returns could be ahead.
What changed
The Buffett indicator hit a record 234%, highlighting extreme market overvaluation relative to U.S. GDP.
Who wins / who loses
Defensive investors and hedgers benefit from caution, while aggressive high-beta equity investors face heightened downside risk.
Time horizon
Think in terms of the next few months.
Confidence & best fit
high confidence · Long-term investor
Safer theme exposure (ETFs)
Baskets that own the theme without betting on one company.
Single stocks (higher risk)
Primary = closest to the story · Peers = same industry · Second-order = knock-on effects · Avoid = looks related but may be a trap
Primary
- $SPYWatch — track, don’t rush
Represents the overall stock market that is hitting record high valuation levels.
View $SPY chart → · End-of-day delayed data
Second-order
- $SHWatch — track, don’t rush
A fund that goes up when the stock market goes down, useful for tracking potential drops.
Options (education only)
No strikes or expiries — a framework for how traders might express the view. Options can expire worthless.
Direction: volatile · Style: Protective put / downside hedge idea · Level: intermediate
Think of it like buying insurance on your stock portfolio; beginners should generally skip this unless they have existing stock holdings to protect.
Income / OppHub America angle
Not a trade tip — ways to use the insight outside the market.
- Review portfolio asset allocation and rebalance away from runaway equity exposure toward cash or fixed income.
What would break this thesis
- Continued explosive productivity growth and sustained corporate earnings expansion that structurally justifies higher valuation multiples.
What to do next on OppHub America
Saved playbooks stay on this device for now.
Important
Not financial advice. OppHub America playbooks are educational market maps only — not recommendations to buy, sell, or hold any security. Markets move fast; information can be wrong or outdated. Trade and invest at your own risk. Do your own research or consult a licensed advisor.
Based on reporting from yahoo-tickers-tape-movers.
Informational and educational only — not investment, financial, or legal advice. Disclosure
Shares a vertical MP4 loop to your phone's camera roll or app share sheet (Instagram, TikTok, Facebook Reels).