Barry, OppHub America Desk · · Source: yahoo-tickers-tape-movers
Solana Price Outlook: What a Move to $1,000 Requires
Cryptocurrency market participants should monitor spot flow trends and circulating token inflation metrics as key risk indicators for digital asset exposure.
Based on reporting from yahoo-tickers-tape-movers.
Solana trades near $101, requiring a near-tenfold rally and a market cap of about $589.8 billion to hit $1,000. Institutional ETF headwinds and token supply expansion continue to challenge long-term bullish forecasts.
Market context for this story
As of: WeekendLoading quotes…
Informational only — not investment advice. Full markets →

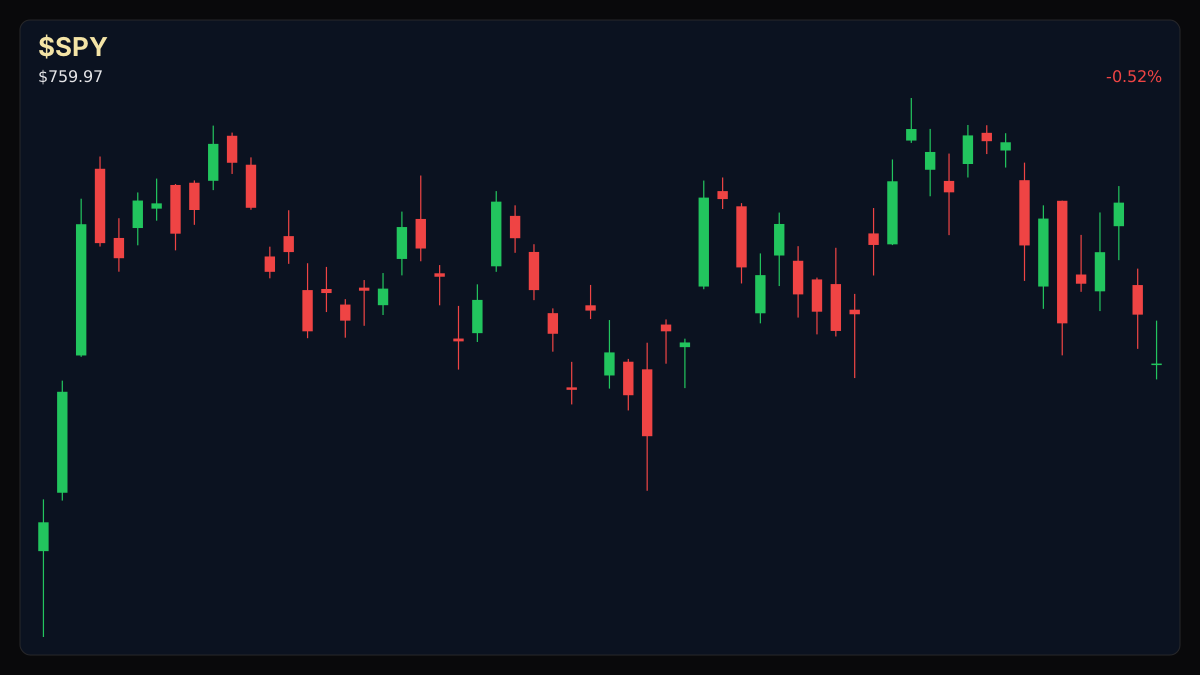
$SPYSPDR S&P 500 ETF
TradingView
Live chart & market data via TradingView · OppHub classroom · Delayed or exchange real-time per TradingView data agreements · Not investment advice
Educational TradingView chart — search any symbol in the widget. Confirm on /markets/SPY. Not investment advice.
Related markets
Shares a vertical MP4 loop to your phone's camera roll or app share sheet (Instagram, TikTok, Facebook Reels).
Solana faces steep structural hurdles on its path to a $1,000 valuation from its current price near $101, requiring a market capitalization near $589.8 billion.
### Tape / Session Read Broader equity benchmarks closed mixed ahead of the weekend, with the S&P 500 down 0.06% at 7,635.20, the Dow Jones lower by 0.03% at 52,267.80, the Nasdaq 100 dropping 0.12% to 28,984.60, and the Russell 2000 rising 0.09% to 2,781.20. Against this mixed macroeconomic backdrop, cryptocurrency markets navigate shifting investor flows and supply dynamics.
### Why This Lane Matters Digital asset valuations depend heavily on circulating supply inflation and incoming institutional demand via spot exchange-traded products. Solana's lack of a maximum token supply means staking inflation continuously introduces new tokens, raising the absolute market capitalization required to sustain higher price milestones.
### Market Dynamics & Structural Risks Solana has surged over 14,700% since April 2020, yet it remains down about 65.6% from its January 19, 2025 peak of $293. U.S. spot Solana exchange-traded funds experienced sustained outflows from October 5 through October 22, paring cumulative inflows down to $1.54 billion. Analysts estimate the probability of reaching four-digit prices before 2028 below 10%, with persistent institutional outflows leaving the asset vulnerable to retesting its July low around $74.
Read the full story
Original reporting and related coverage — attribution links only, not paid recommendations.
Trade this story (crypto)
 Coinbase
 Gemini
 Robinhood
 Webull
Chart this story
 TradingView
Broker and exchange buttons use invite / refer-a-friend links (rewards may be capped). Charting links (TradingView) are partner offers that may pay OppHub America a commission at no extra cost to you.
OppSHOP
Full OppSHOP →As an Amazon Associate, OppHub America earns from qualifying purchases. Shopping here helps keep the site free — at no extra cost to you. Disclosure

OppSHOP
Related to this story
Cryptocurrency market participants should monitor spot flow trends and c
Shop related →

Investing books
Read the classics
Shop this pick →

Personal finance books
Run the household books
Shop this pick →

Trading notebooks
Write the thesis first
Shop this pick →

Monitor for charts
See every pane
Shop this pick →
Story playbook
A pre-built map of what to watch — stocks, ETFs, and educational next steps. Not personalized advice.
Snapshot date: October 25, 2026 at 8:56 PM ET
This playbook was built when the story published and is not live-updated. Prices, news, and risk can change after this date — treat it as a starting map, not a current trade ticket.
Story → money map
crypto asset valuation
Solana's price is far below its previous highs because of new token creation and a lack of strong investment from large institutions. People who follow crypto are watching these trends closely to see if prices will drop further.
What changed
Solana faces continued institutional ETF outflows and token supply inflation pressures, keeping its price near $101 against a lofty $1,000 long-term target.
Who wins / who loses
Broad crypto market infrastructure providers benefit from activity, while concentrated holders of Solana face dilution and downside volatility risks.
Time horizon
Think in terms of the next few months.
Confidence & best fit
low confidence · Long-term investor, Active trader
Low confidence → prefer ETFs and “Watch,” not rushing into one stock.
Safer theme exposure (ETFs)
Baskets that own the theme without betting on one company.
Single stocks (higher risk)
Primary = closest to the story · Peers = same industry · Second-order = knock-on effects · Avoid = looks related but may be a trap
Peer
- $COINWatch — track, don’t rush
A major crypto exchange company that tracks overall interest in digital currencies.
View $COIN chart → · End-of-day delayed data
Options (education only)
No strikes or expiries — a framework for how traders might express the view. Options can expire worthless.
Beginners should avoid crypto options entirely due to fast-moving prices that can wipe out money quickly.
See options-friendly brokers →Income / OppHub America angle
Not a trade tip — ways to use the insight outside the market.
- Monitor network staking yields and decentralized application usage metrics for fundamental growth signals.
What would break this thesis
- A sustained reversal of institutional ETF outflows into net positive inflows.
What to do next on OppHub America
Saved playbooks stay on this device for now.
Important
Not financial advice. OppHub America playbooks are educational market maps only — not recommendations to buy, sell, or hold any security. Markets move fast; information can be wrong or outdated. Trade and invest at your own risk. Do your own research or consult a licensed advisor.
Based on reporting from yahoo-tickers-tape-movers.
Informational and educational only — not investment, financial, or legal advice. Disclosure
Shares a vertical MP4 loop to your phone's camera roll or app share sheet (Instagram, TikTok, Facebook Reels).