OppHub America Desk · · Source: yahoo-tickers-tape-movers
Nvidia Stock Faces Potential First Losing Year Since 2022
If $NVDA+WL sustains oversold readings with an of 26.9 near its 200-day moving average, traders should watch key support thresholds at $201.66 and $200.92 for potential short-term mean-reversion bounces.
Based on reporting from yahoo-tickers-tape-movers.
Nvidia Corporation faces a rare negative annual return as semiconductor equities consolidate amid broader market pressures. Investors are examining historical down years and recovery precedents for the artificial intelligence hardware leader. Nvidia shares trade alongside broader tape movements with an RSI of 26.9.
Market context for this story
As of: WeekendLoading quotes…
Informational only — not investment advice. Full markets →


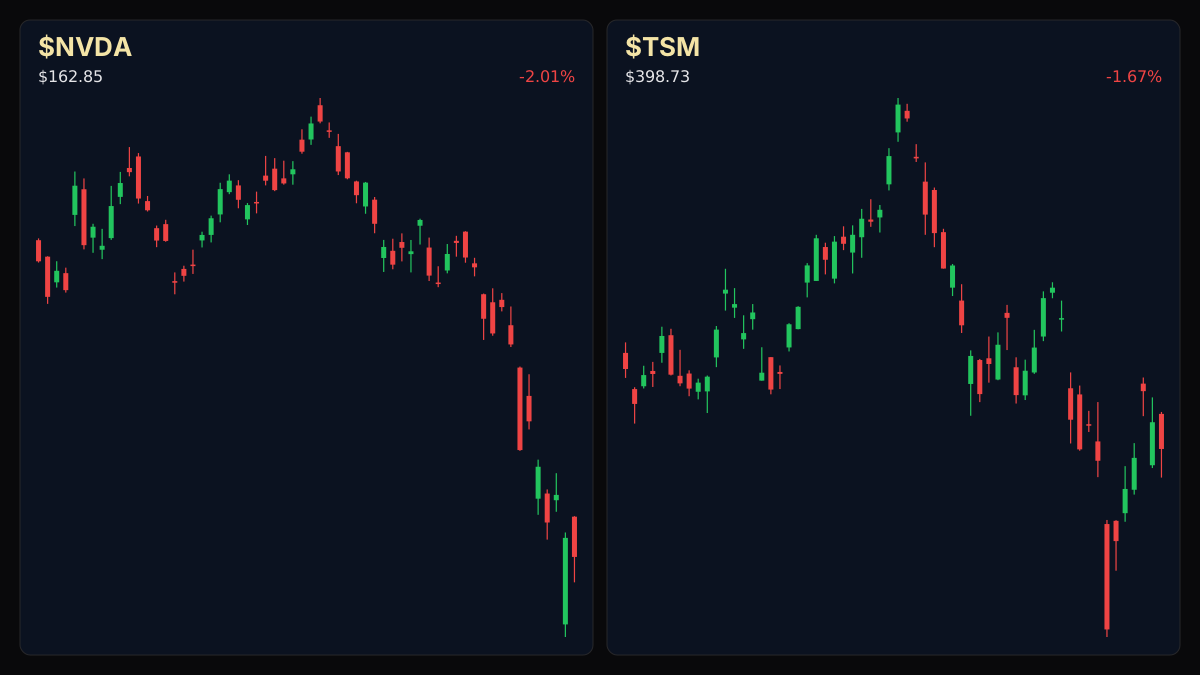
$NVDA
TradingView
Live chart & market data via TradingView · OppHub classroom · Delayed or exchange real-time per TradingView data agreements · Not investment advice
$TSM
TradingView
Live chart & market data via TradingView · OppHub classroom · Delayed or exchange real-time per TradingView data agreements · Not investment advice
Educational TradingView charts — search any symbol in the widget. Confirm on /markets/NVDA and related $TSM, $MSFT, $AAPL. Not investment advice.
Related markets
Shares a vertical MP4 loop to your phone's camera roll or app share sheet (Instagram, TikTok, Facebook Reels).
### Money Play - **$NVDA+WL:** If the hardware leader tests deeper support levels near recent lows, watch volume multiples and 50-day moving averages for potential oversold mean-reversion setups.
### Session Tape - **$NVDA+WL:** -2.0% ($162.85 close in tape facts; live reference $202.06, -1.26% session) - **$MSFT+WL:** +0.2% ($523.88 close in tape facts; live reference $507.12, -2.83% session) - **$AAPL+WL:** +0.4% ($356.27 close in tape facts; live reference $342.37, -0.52% session)
## Catalyst Analysis: Historical Down Years and Semiconductor Tape Pressure Nvidia Corporation (NASDAQ: NVDA) is tracking toward a potential first negative calendar year since 2022, down around 11% so far in 2026. Historically, the chipmaker has experienced seven losing calendar years, including drops of 83% in 2002, 76% in 2008, 31% in 2018, and 50% in 2022, as well as milder pullbacks of 18% in 2010, 10% in 2011, and 12% in 2012. In past cycles, deep drawdowns frequently coincided with temporary contractions in net income, such as a 49% drop in fiscal 2003 and a 55% decline in fiscal 2023, before subsequent multi-year expansions. Most recently, Nvidia reported strong operational growth, with net income rising 65% in fiscal 2026 and growing 126% year-over-year in its latest reported quarter, contrasted against ongoing price consolidation.
### Story Arc / How We Got Here Today's semiconductor tape action follows persistent distribution across artificial intelligence hardware leaders. As detailed in our prior coverage on [Nvidia Stock: Erases $1.3T in Market Value After 5th Losing Week](/explore/nvidia-stock-erases-13t-in-market-value-after-5th-losing-week), high-multiple tech equities faced severe sector headwinds and valuation compression. Current price action extends that volatility profile as traders evaluate historical drawdown analogs.
## $NVDA+WL Technical Analysis & Key Risk Watch — from LIVE MARKET CONTEXT $NVDA+WL trades with an RSI14 of 26.9, signaling oversold territory as volume runs at 1.17x its 20-day average. The stock is positioned near its 200-day moving average of $204.46, below the 50-day moving average of $221.50. Key levels for $NVDA+WL (educational): R2 $213.85 · R1 $209.06 · last $202.06 · S1 $201.66 · S2 $200.92.
## Impact on Related Tickers Semiconductor and mega-cap tech peers reflected mixed tape performance during the session. Microsoft (NASDAQ: MSFT) traded down 2.83% to $507.12 with an RSI of 27.8 and volume at 1.57x normal levels, while Apple (NASDAQ: AAPL) moved down 0.52% to $342.37 with an RSI of 49.6.
Read the full story
Original reporting and related coverage — attribution links only, not paid recommendations.
Trade this story
 Robinhood
 Webull
 Tradier
 IBKR
Chart this story
 TradingView
Broker and exchange buttons use invite / refer-a-friend links (rewards may be capped). Charting links (TradingView) are partner offers that may pay OppHub America a commission at no extra cost to you.
OppSHOP
Full OppSHOP →As an Amazon Associate, OppHub America earns from qualifying purchases. Shopping here helps keep the site free — at no extra cost to you. Disclosure

OppSHOP
Related to this story
If $NVDA sustains oversold readings with an of 26.9 near its 200-day mov
Shop related →

Investing books
Read the classics
Shop this pick →

Personal finance books
Run the household books
Shop this pick →

Trading notebooks
Write the thesis first
Shop this pick →

Monitor for charts
See every pane
Shop this pick →
Based on reporting from yahoo-tickers-tape-movers.
Informational and educational only — not investment, financial, or legal advice. Disclosure
Shares a vertical MP4 loop to your phone's camera roll or app share sheet (Instagram, TikTok, Facebook Reels).