Barry, OppHub America Desk · · Source: yahoo-tickers-tape-movers
Nvidia Stock: CEO Jensen Huang Departure & Headwinds
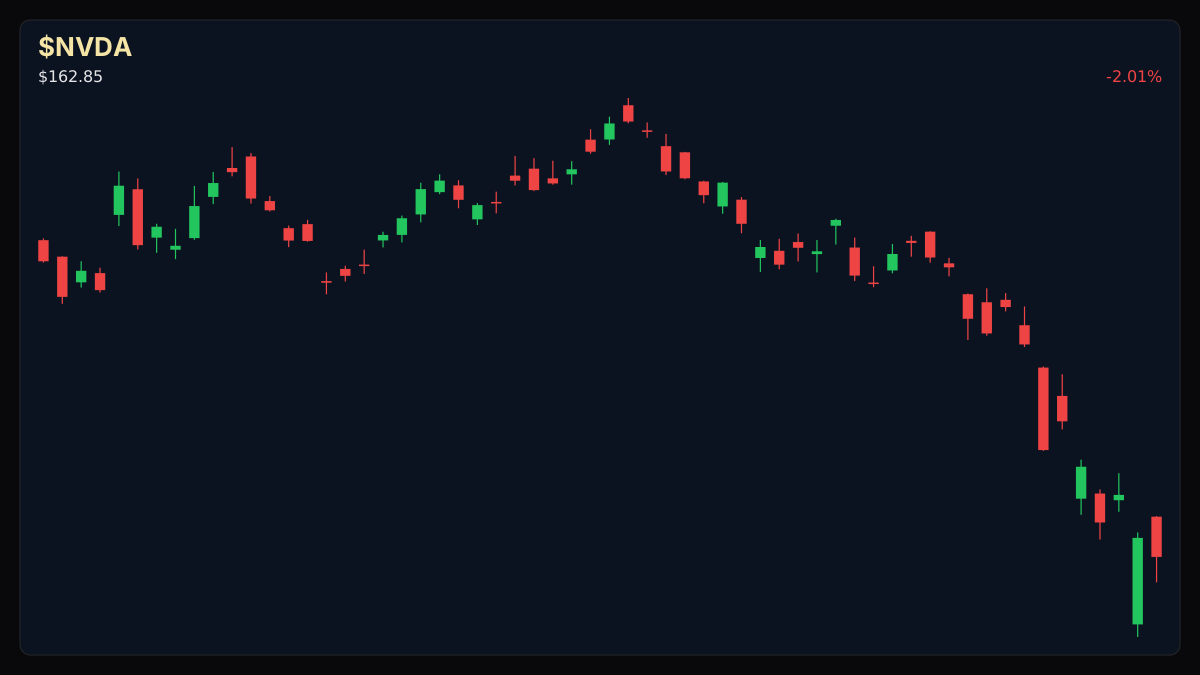
If $NVDA+WL tests key support levels near $201.66 with oversold readings, watch for potential mean-reversion bounces among institutional accumulation desks.
Based on reporting from yahoo-tickers-tape-movers.
Nvidia shares face acute tape pressure alongside executive transition headlines and sector-wide risk aversion during Monday premarket activity. Traders are reassessing hardware valuations and technical support zones as broader indices slip.
Market context for this story
As of: PremarketLoading quotes…
Informational only — not investment advice. Full markets →

$NVDA
TradingView
Live chart & market data via TradingView · OppHub classroom · Delayed or exchange real-time per TradingView data agreements · Not investment advice
Educational TradingView chart — search any symbol in the widget. Confirm on /markets/NVDA. Not investment advice.
Related markets
Shares a vertical MP4 loop to your phone's camera roll or app share sheet (Instagram, TikTok, Facebook Reels).
Nvidia (NASDAQ: NVDA) shares extended losses during premarket sessions, pressured by leadership transition scrutiny and broader equity tape weakness on Monday, November 16, 2026.
### Session Tape - $NVDA+WL: $202.06 (-1.26%)
## Catalyst Analysis: Executive Scrutiny and Tape Pressure The premarket session reflects mounting headwinds for semiconductor leaders, compounded by executive transition reports surrounding co-founder and CEO Jensen Huang. Institutional desks are weighing valuation multiples against evolving competitive pressures and margin projections across major hardware portfolios.
### Story Arc / How We Got Here Today's action follows a prior 5% pullback recorded on Monday, November 9, 2026, as detailed in our coverage of Nvidia Stock Pullback: Tape Pressure and Jensen Huang Outlook (/explore/nvidia-stock-pullback-tape-pressure-and-jensen-huang-outlook). That session forced desks to re-evaluate hardware valuations and leadership trajectory under CEO Jensen Huang amid premarket volatility.
## $NVDA+WL Technical Analysis & Key Risk Watch — from LIVE MARKET CONTEXT Key levels for $NVDA+WL (educational): R2 $213.85 · R1 $209.06 · last $202.06 · S1 $201.66 · S2 $200.92. With an RSI of 26.9 and volume tracking at 1.17x its 20-day average, the stock tests oversold territory near crucial support boundaries, inviting close observation from mean-reversion desks.
### Impact on Related Tickers Broader tech indices felt the ripple effect, with major equities absorbing profit-taking as market breadth shifted toward defensive positioning.
Not financial advice. Market bias reflects positioning context only.
Read the full story
Original reporting and related coverage — attribution links only, not paid recommendations.
Trade this story
 Robinhood
 Webull
 Tradier
 IBKR
Chart this story
 TradingView
Broker and exchange buttons use invite / refer-a-friend links (rewards may be capped). Charting links (TradingView) are partner offers that may pay OppHub America a commission at no extra cost to you.
OppSHOP
Full OppSHOP →As an Amazon Associate, OppHub America earns from qualifying purchases. Shopping here helps keep the site free — at no extra cost to you. Disclosure

OppSHOP
Related to this story
If $NVDA tests key support levels near $201.66 with oversold readings, w
Shop related →

Investing books
Read the classics
Shop this pick →

Personal finance books
Run the household books
Shop this pick →

Trading notebooks
Write the thesis first
Shop this pick →
Monitor for charts
See every pane
Shop this pick →
Story playbook
A pre-built map of what to watch — stocks, ETFs, and educational next steps. Not personalized advice.
Snapshot date: November 16, 2026 at 5:55 AM ET
This playbook was built when the story published and is not live-updated. Prices, news, and risk can change after this date — treat it as a starting map, not a current trade ticket.
Story → money map
AI chips and semiconductor volatility
Nvidia's stock price dropped in early trading because of questions about leadership and a general slump in the tech market. Investors are watching closely to see if the stock can bounce back from these lower prices.
What changed
Nvidia shares extended losses in premarket trading alongside executive transition scrutiny and sector-wide risk aversion.
Who wins / who loses
Semiconductor hardware competitors and defensive sectors benefit from capital rotation, while Nvidia and high-multiple hardware suppliers are hurt.
Time horizon
Think in terms of next few days.
Confidence & best fit
medium confidence · Active trader
Safer theme exposure (ETFs)
Baskets that own the theme without betting on one company.
Single stocks (higher risk)
Primary = closest to the story · Peers = same industry · Second-order = knock-on effects · Avoid = looks related but may be a trap
Primary
- $NVDAWatch — track, don’t rush
The main stock in the news is dropping, and traders are watching to see if it becomes a bargain buy.
View $NVDA chart → · End-of-day delayed data
Peer
- $AMDWatch — track, don’t rush
Rival chip companies often move up and down along with Nvidia.
View $AMD chart → · End-of-day delayed data
- $INTCStay away — for now
Older tech hardware makers may also suffer from negative sentiment in the chip sector.
View $INTC chart → · End-of-day delayed data
Options (education only)
No strikes or expiries — a framework for how traders might express the view. Options can expire worthless.
Direction: volatile · Style: Debit spread (defined risk) · Level: intermediate
Advanced traders might use options to bet on a small bounce while limiting their potential losses. Beginners should skip options here due to high volatility.
Income / OppHub America angle
Not a trade tip — ways to use the insight outside the market.
- Review personal tech sector allocation limits in broader retirement portfolios.
What would break this thesis
- A decisive breakdown below crucial support levels accompanied by heavy volume would invalidate the mean-reversion watch thesis.
What to do next on OppHub America
Saved playbooks stay on this device for now.
Important
Not financial advice. OppHub America playbooks are educational market maps only — not recommendations to buy, sell, or hold any security. Markets move fast; information can be wrong or outdated. Trade and invest at your own risk. Do your own research or consult a licensed advisor.
Based on reporting from yahoo-tickers-tape-movers.
Informational and educational only — not investment, financial, or legal advice. Disclosure
Shares a vertical MP4 loop to your phone's camera roll or app share sheet (Instagram, TikTok, Facebook Reels).