Barry, OppHub America Desk · · Source: businesswire-google
Private Markets Rebound 1.9% in Q2 on Earnings Growth
Based on reporting from businesswire-google.
Private company valuations rose 1.9% in the second quarter of 2026, reversing a prior decline, driven by robust earnings growth. This contrasts with the significant rebound seen in public markets, highlighting different valuation drivers.
Market context for this story
As of: PremarketLoading quotes…
Informational only — not investment advice. Full markets →


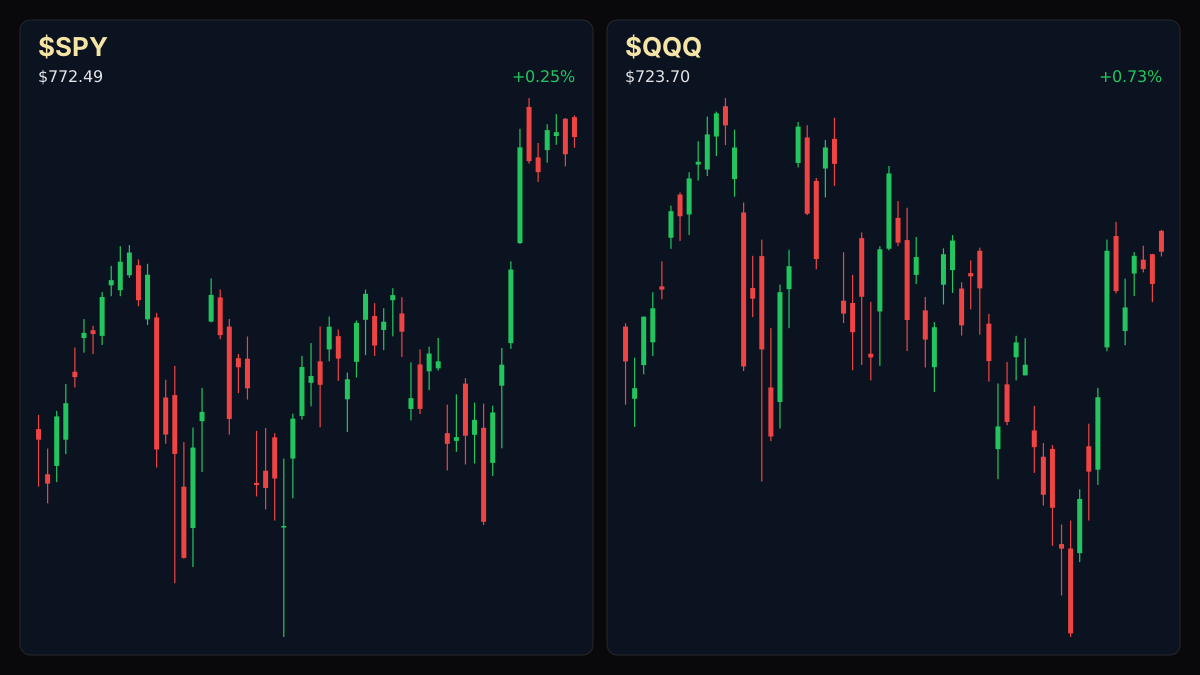
$SPYSPDR S&P 500 ETF
TradingView
Live chart & market data via TradingView · OppHub classroom · Delayed or exchange real-time per TradingView data agreements · Not investment advice
Educational TradingView chart — search any symbol in the widget. Confirm on /markets/SPY and related $QQQ. Not investment advice.
Related markets
Shares a vertical MP4 loop to your phone's camera roll or app share sheet (Instagram, TikTok, Facebook Reels).
Private company valuations, tracked by the Lincoln Private Market Index, increased by 1.9% in the second quarter of 2026. This marks a recovery from a 2.2% decline in the first quarter, with the rebound attributed to strong EBITDA growth that counteracted modest contractions in valuation multiples. In comparison, the S&P 500 saw enterprise values surge by 14.8%, or 15.4% excluding the Magnificent 7, driven largely by AI-related optimism and multiple expansion.
### Money Play Given the focus on underlying operational performance in private markets, investors might consider strategies that benefit from stable enterprise growth rather than broad market sentiment shifts. The divergence between public and private market performance suggests distinct catalysts are at play, warranting a focused approach to sector and company selection. ### Executive Thesis The Q2 private market performance underscores a fundamental earnings-driven recovery, distinct from the speculative surge observed in public equities. This indicates resilience in privately held businesses, even as public markets react more volatiIly to future growth expectations, particularly in AI. ### The Print Private company enterprise values increased by 1.9% in Q2 2026, recovering from a 2.2% decline in Q1. Year-over-year revenue growth for private companies accelerated to 6.9% in Q2 from 6.5% in Q1, while EBITDA growth rose to 5.6% from 4.7%. The percentage of companies reporting year-over-year revenue growth increased to 70.7% from 69.6%, and those reporting EBITDA growth rose to 64.0% from 62.4%. ### Market Reaction No direct market reaction data for private markets was Public market indices like the S&P 500 showed significant gains in the same period. ### What It Means for Policy & Positioning The divergence suggests that central bank policy and broad economic conditions may impact public equities more directly through interest rate expectations and liquidity. Private market valuations, tied more closely to current operational performance, might be less sensitive to short-term monetary policy shifts but are influenced by long-term economic fundamentals. ### Next Calendar Watch No specific next calendar watch items were
Read the full story
Original reporting and related coverage — attribution links only, not paid recommendations.
Trade this story
 Robinhood
 Webull
 Tradier
 IBKR
IBKR
Chart this story
 TradingView
Broker and exchange buttons use invite / refer-a-friend links (rewards may be capped). Charting links (TradingView) are partner offers that may pay OppHub America a commission at no extra cost to you.
OppSHOP
Full OppSHOP →As an Amazon Associate, OppHub America earns from qualifying purchases. Shopping here helps keep the site free — at no extra cost to you. Disclosure





Story playbook
A pre-built map of what to watch — stocks, ETFs, and educational next steps. Not personalized advice.
Snapshot date: August 13, 2026 at 8:55 AM ET
This playbook was built when the story published and is not live-updated. Prices, news, and risk can change after this date — treat it as a starting map, not a current trade ticket.
Story → money map
private vs public valuation divergence
Private businesses saw their values increase slightly in the second quarter thanks to actual profit growth, even though public stocks grew much faster. Money experts care because it shows private companies are still healthy, but public markets are reacting more to hype.
What changed
Private market valuations rebounded by 1.9% in Q2 2026 driven by steady EBITDA growth, contrasting with a much larger surge in public equities.
Who wins / who loses
Private business owners and stable earners benefit from fundamental growth, while purely speculative public market segments face valuation contraction risks if earnings disappoint.
Time horizon
Think in terms of the next few months.
Confidence & best fit
medium confidence · Long-term investor
Safer theme exposure (ETFs)
Baskets that own the theme without betting on one company.
Single stocks (higher risk)
Primary = closest to the story · Peers = same industry · Second-order = knock-on effects · Avoid = looks related but may be a trap
Primary
- $SPYWatch — track, don’t rush
Tracks the overall stock market so you can compare public stock gains with private company gains.
View $SPY chart → · End-of-day delayed data
Peer
- $QQQWatch — track, don’t rush
Tracks big technology stocks that are growing much faster based on future excitement.
View $QQQ chart → · End-of-day delayed data
Second-order
- $IWMBuild slowly — only if it fits your plan
Tracks smaller public companies, which act a lot like the private businesses mentioned in the story.
View $IWM chart → · End-of-day delayed data
Options (education only)
No strikes or expiries — a framework for how traders might express the view. Options can expire worthless.
Beginners should skip options here entirely and stick to holding broad index funds for the long term.
See options-friendly brokers →Income / OppHub America angle
Not a trade tip — ways to use the insight outside the market.
- Focus on operational efficiency and local business cash flow metrics in private ventures.
What would break this thesis
- A sharp contraction in corporate earnings or a severe liquidity freeze in broader credit markets.
What to do next on OppHub America
Saved playbooks stay on this device for now.
Important
Not financial advice. OppHub America playbooks are educational market maps only — not recommendations to buy, sell, or hold any security. Markets move fast; information can be wrong or outdated. Trade and invest at your own risk. Do your own research or consult a licensed advisor.
Aftermath · $BAC
+3.57% vs write
- •Since this piece: $BAC is up +3.57% vs $61.95 at write time (now $64.16).
- •Session move (Yahoo delayed): +0.09%.
- •RSI14 at write was 64.3 — compare levels on Markets, not advice.
- •Original money play lens: Policy → markets spillover
- •Track $BAC live on OppHub Markets (/markets/BAC). Not financial advice.
Based on reporting from businesswire-google.
Informational and educational only — not investment, financial, or legal advice. Disclosure
Shares a vertical MP4 loop to your phone's camera roll or app share sheet (Instagram, TikTok, Facebook Reels).