Barry, OppHub America Desk · · Source: yahoo-tickers-tape-movers
Vanguard S&P 500 ETF vs Lululemon: Valuation & Performance
Housing & mortgages: Rate and housing policy spill into builders, small-caps, and REITs.
Based on reporting from yahoo-tickers-tape-movers.
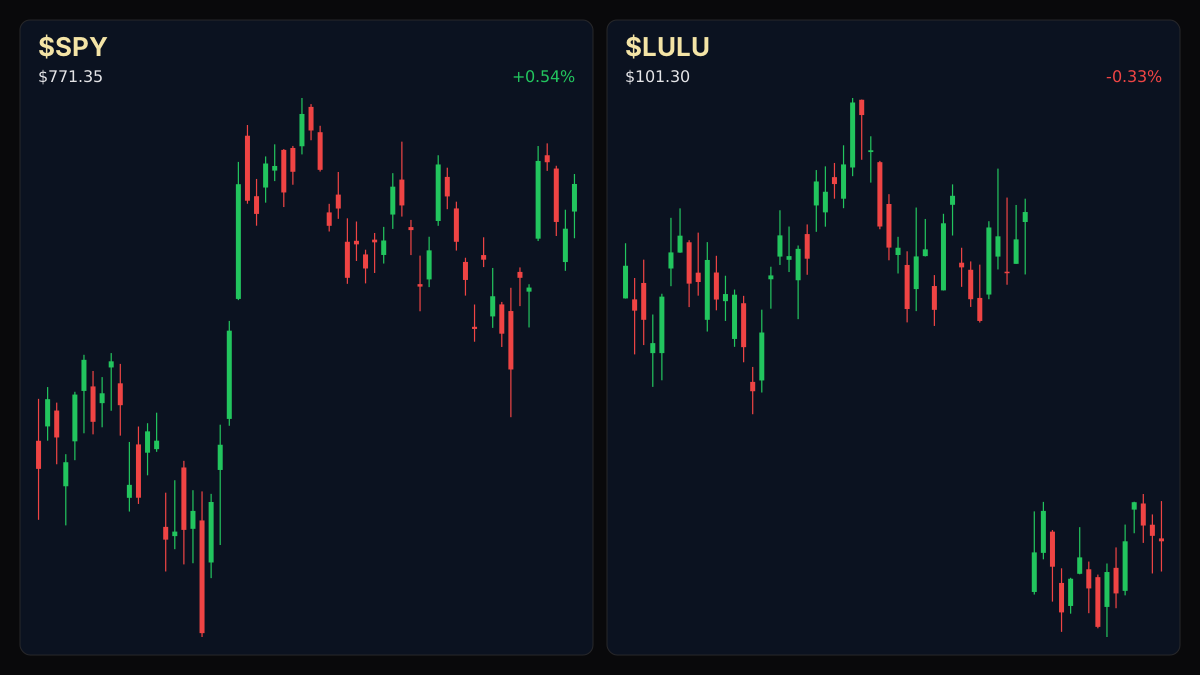
As the Vanguard S&P 500 ETF hovers near record highs, retail peer Lululemon struggles following a second-quarter revenue decline and contracting same-store sales. Investors weigh broad market index exposure against single-stock retail drawdowns.
Market context for this story
As of: WeekendLoading quotes…
Informational only — not investment advice. Full markets →


$SPYSPDR S&P 500 ETF
TradingView
Live chart & market data via TradingView · OppHub classroom · Delayed or exchange real-time per TradingView data agreements · Not investment advice
Educational TradingView chart — search any symbol in the widget. Confirm on /markets/SPY and related $LULU. Not investment advice.
Related markets
Shares a vertical MP4 loop to your phone's camera roll or app share sheet (Instagram, TikTok, Facebook Reels).
### Session Tape — Vanguard S&P 500 ETF (+0.54%), Lululemon (-0.34%)
## Catalyst Analysis: Broad Index Resilience vs. Retail Headwinds The Vanguard S&P 500 ETF continues to demonstrate stability, supported by a low expense ratio of 0.03% and $1.8 trillion in assets under management. Over the decade preceding September 24, the index vehicle delivered a total return of 319%, trading just 1% below its peak established in August. In contrast, apparel equities face severe multiple contraction following recent fiscal second-quarter metrics ending August 2.
Lululemon posted a 4% year-over-year revenue contraction alongside a 9% slide in same-store sales, dragging net income down by 11%. The retail entity now trades roughly 80% below its December 2023 peak, reflecting persistent pressure on discretionary margins and shifting consumer demand patterns.
## Impact on Index Allocation and Retail Allocation For portfolios balancing passive index exposure against individual equities, the relative strength of broad market vehicles highlights a flight toward lower-cost structural holdings. Concentration within major index constituents—including large-cap technology weightings—continues to anchor overall market performance compared to pressured consumer discretionary names.
### Money Play
Read the full story
Original reporting and related coverage — attribution links only, not paid recommendations.
Trade this story
 Robinhood
 Webull
 Tradier
 IBKR
IBKR
Chart this story
 TradingView
Broker and exchange buttons use invite / refer-a-friend links (rewards may be capped). Charting links (TradingView) are partner offers that may pay OppHub America a commission at no extra cost to you.
OppSHOP
Full OppSHOP →As an Amazon Associate, OppHub America earns from qualifying purchases. Shopping here helps keep the site free — at no extra cost to you. Disclosure

OppSHOP
Related to this story
Housing & mortgages: Rate and housing policy spill into builders, small-
Shop related →

Investing books
Read the classics
Shop this pick →

Personal finance books
Run the household books
Shop this pick →

Trading notebooks
Write the thesis first
Shop this pick →

Monitor for charts
See every pane
Shop this pick →
Story playbook
A pre-built map of what to watch — stocks, ETFs, and educational next steps. Not personalized advice.
Snapshot date: September 27, 2026 at 3:02 PM ET
This playbook was built when the story published and is not live-updated. Prices, news, and risk can change after this date — treat it as a starting map, not a current trade ticket.
Story → money map
broad market vs retail weakness
The overall stock market is doing very well, but some clothing stores like Lululemon are struggling to make sales. Because of this, investors are moving their money into safer, broad market funds instead of risky individual stores.
What changed
Broad stock market indexes remain resilient near record highs while consumer discretionary retail names face severe revenue contractions and declining same-store sales.
Who wins / who loses
Broad market index funds and low-cost passive ETFs win as capital flees, while discretionary apparel retailers and pressured consumer brands lose.
Time horizon
Think in terms of the next few months.
Confidence & best fit
medium confidence · Long-term investor
Safer theme exposure (ETFs)
Baskets that own the theme without betting on one company.
Single stocks (higher risk)
Primary = closest to the story · Peers = same industry · Second-order = knock-on effects · Avoid = looks related but may be a trap
Primary
- $LULUWatch — track, don’t rush
The store is making less money and its stock price has dropped a lot, so we need to wait and see if business picks up before buying.
View $LULU chart → · End-of-day delayed data
Peer
- $NKEStay away — for now
Other clothing brands might also suffer because shoppers are spending less.
View $NKE chart → · End-of-day delayed data
Options (education only)
No strikes or expiries — a framework for how traders might express the view. Options can expire worthless.
Direction: bearish · Style: Protective put / downside hedge idea · Level: intermediate
Beginners should skip options here; buying insurance-like contracts on struggling stocks can be tricky and expensive.
Income / OppHub America angle
Not a trade tip — ways to use the insight outside the market.
- Rebalancing portfolios away from single-stock retail risk into diversified index funds.
What would break this thesis
- A sharp rebound in consumer discretionary spending and unexpected same-store sales growth for apparel.
What to do next on OppHub America
Saved playbooks stay on this device for now.
Important
Not financial advice. OppHub America playbooks are educational market maps only — not recommendations to buy, sell, or hold any security. Markets move fast; information can be wrong or outdated. Trade and invest at your own risk. Do your own research or consult a licensed advisor.
Based on reporting from yahoo-tickers-tape-movers.
Informational and educational only — not investment, financial, or legal advice. Disclosure
Shares a vertical MP4 loop to your phone's camera roll or app share sheet (Instagram, TikTok, Facebook Reels).