OppHub America Desk · · Source: yahoo-tickers-tape-movers
Procter & Gamble Dividend Growth and Market Tape Movers
Income-focused positioning relies on consistent payout histories rather than short-term tape volatility. Watch payout ratios and free cash flow coverage when evaluating long-term dividend commitments.
Based on reporting from yahoo-tickers-tape-movers.
Procter & Gamble continues its multi-decade dividend growth streak through historical recessions, supporting income investors as major market indexes shift. On Sunday, November 8, 2026, broad equity tape benchmarks reflect ongoing valuation adjustments across large-cap leaders.
Market context for this story
As of: WeekendLoading quotes…
Informational only — not investment advice. Full markets →


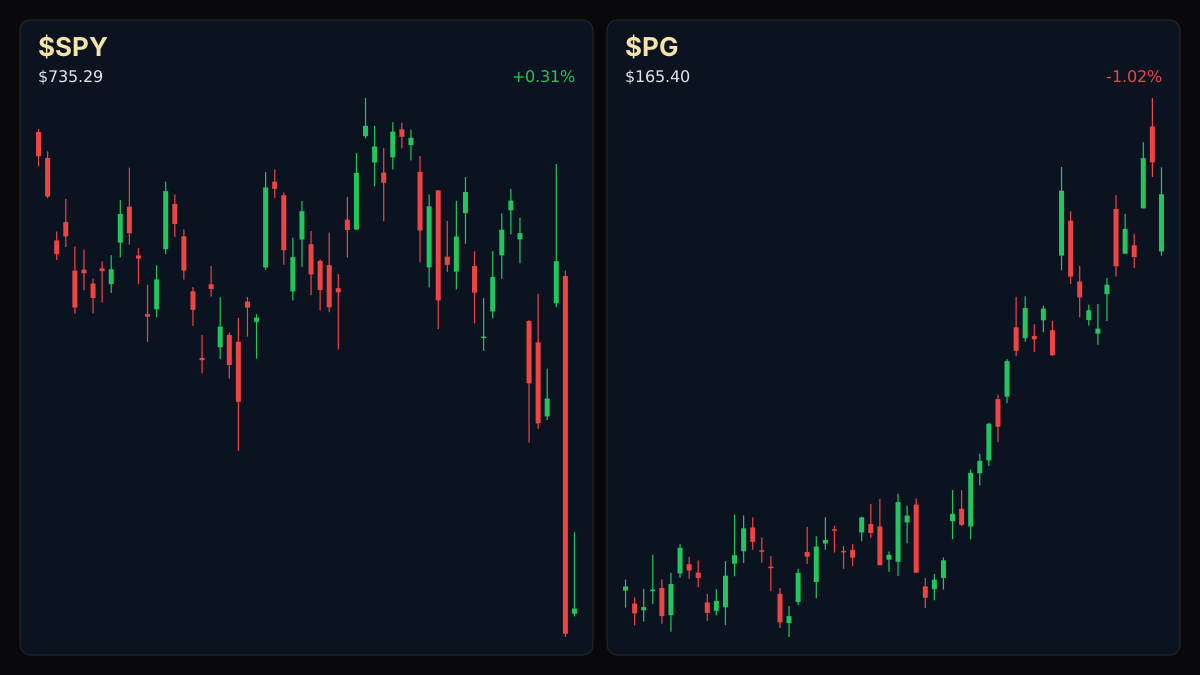
$SPYSPDR S&P 500 ETF
TradingView
Live chart & market data via TradingView · OppHub classroom · Delayed or exchange real-time per TradingView data agreements · Not investment advice
$PGProcter & Gamble
TradingView
Live chart & market data via TradingView · OppHub classroom · Delayed or exchange real-time per TradingView data agreements · Not investment advice
Educational TradingView charts — search any symbol in the widget. Confirm on /markets/SPY and related $PG, $TSLA, $NVDA. Not investment advice.
Related markets
Shares a vertical MP4 loop to your phone's camera roll or app share sheet (Instagram, TikTok, Facebook Reels).
### Session Tape — Sunday, November 8, 2026 - S&P 500: 7,376.86 (+0.3% / +23.13) - Dow Jones Industrial Average: 51,285.73 (-0.5% / -237.33) - NASDAQ: 24,579.42 (+1.1% / +264.43) - Bitcoin: $75,634.00 (-0.2% / -$114.68) - Apple (AAPL): $342.37 (-0.5% / -$1.80) - Microsoft (MSFT): $530.61 (-1.0% / -$5.32) - Nvidia (NVDA): $186.64 (+2.8% / +5.04)
## Catalyst Analysis: Defensive Payout Longevity Amid Broad Tape Action Market participants evaluating income vehicles look to historical resilience as broader equity benchmarks trade mixed. Procter & Gamble ( $PG+WL -1.02% ) maintains a documented trajectory of raising its dividend through every economic downturn since the 1950s, supported by a payout ratio of 67.8% of free cash flow and a 10-year compound annual dividend growth rate (CAGR) of 4.9%. The equity reflects a 16% year-to-date gain, underscoring steady capital allocation amid fluctuating sector breadth.
## Impact on Broad Market Sectors Defensive consumer goods equities offer contrasting risk profiles relative to high-beta technology constituents. While large-cap growth vehicles such as Nvidia and Tesla (TSLA) register notable single-session fluctuations, defensive dividend payers demonstrate consistent cash flow distribution mechanics. Investors weigh these payout yields against shifting macroeconomic signals and prevailing inflation pressures.
Read the full story
Original reporting and related coverage — attribution links only, not paid recommendations.
Trade this story
 Robinhood
 Webull
 Tradier
 IBKR
Chart this story
 TradingView
Broker and exchange buttons use invite / refer-a-friend links (rewards may be capped). Charting links (TradingView) are partner offers that may pay OppHub America a commission at no extra cost to you.
OppSHOP
Full OppSHOP →As an Amazon Associate, OppHub America earns from qualifying purchases. Shopping here helps keep the site free — at no extra cost to you. Disclosure

OppSHOP
Related to this story
Income-focused positioning relies on consistent payout histories rather
Shop related →

Investing books
Read the classics
Shop this pick →

Personal finance books
Run the household books
Shop this pick →

Trading notebooks
Write the thesis first
Shop this pick →

Monitor for charts
See every pane
Shop this pick →
Based on reporting from yahoo-tickers-tape-movers.
Informational and educational only — not investment, financial, or legal advice. Disclosure
Shares a vertical MP4 loop to your phone's camera roll or app share sheet (Instagram, TikTok, Facebook Reels).