Barry, OppHub America Desk · · Source: yahoo-tickers-tape-movers
Macro Pressure and AI Earnings Test Markets This Week
Manage risk dynamically around upcoming inflation data prints and technology earnings.
Based on reporting from yahoo-tickers-tape-movers.
Markets face a pivotal test as the Nasdaq enters correction territory amid technology sector pressure, with October consumer price inflation and producer price data arriving alongside key artificial intelligence infrastructure earnings. Investors are balancing infrastructure demand against broader macro rate path signals.
Market context for this story
As of: WeekendLoading quotes…
Informational only — not investment advice. Full markets →

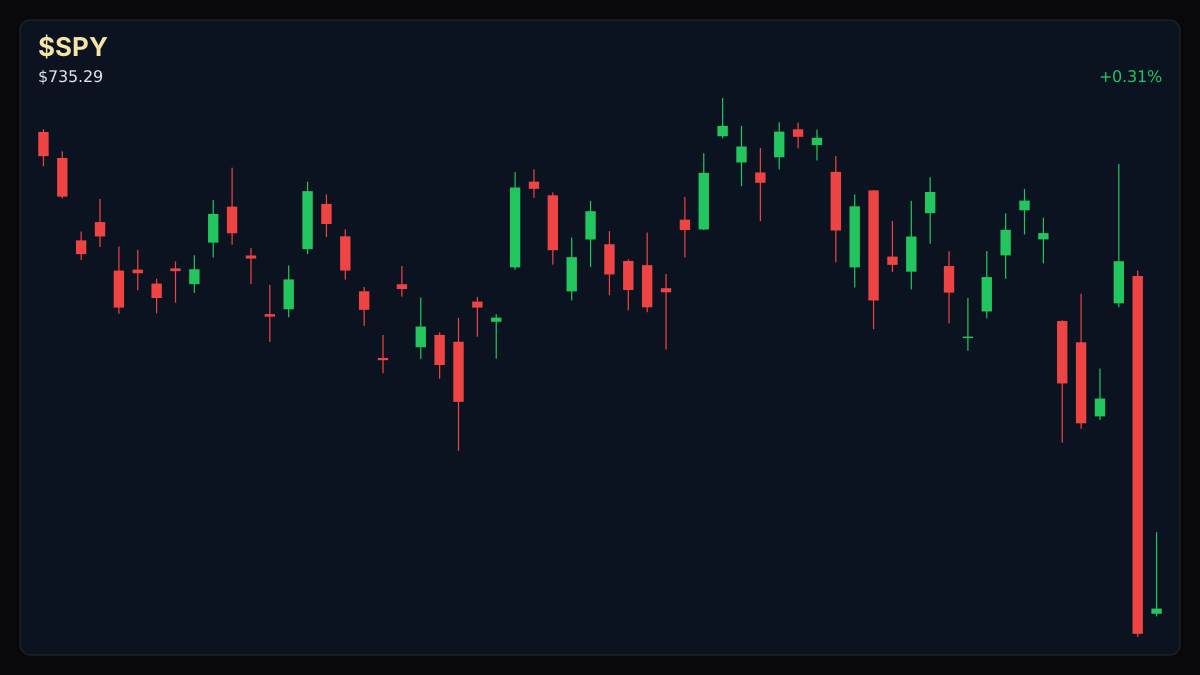
$SPYSPDR S&P 500 ETF
TradingView
Live chart & market data via TradingView · OppHub classroom · Delayed or exchange real-time per TradingView data agreements · Not investment advice
Educational TradingView chart — search any symbol in the widget. Confirm on /markets/SPY. Not investment advice.
Related markets
Shares a vertical MP4 loop to your phone's camera roll or app share sheet (Instagram, TikTok, Facebook Reels).
Markets face a pivotal test as the Nasdaq enters correction territory amid technology sector pressure, with October consumer price inflation and producer price data arriving alongside key artificial intelligence infrastructure earnings. Investors are balancing infrastructure demand against broader macro rate path signals.
### Money Play As macro data and major AI earnings cross the tape, market participants should monitor positioning closely given elevated volatility across technology holdings. With no specific single-name tickers ### Executive Thesis Technology shares face renewed scrutiny as a correction unfolds across the Nasdaq, shedding nearly 12% from previous record highs. The convergence of October inflation metrics and upcoming corporate results from data-centre power suppliers and cloud providers will dictate whether risk appetite stabilizes or contracts further.
### The Print Recent government data indicates the Producer Price Index for final demand increased 1.3% on a seasonally adjusted basis, while the Consumer Price Index (CPI-U) increased 0.6% on a seasonally adjusted basis, bringing the 12-month all items increase to 3.7%. Economists anticipate core consumer prices to rise 0.2% month over month, potentially lifting the annual rate to 2.7% from 2.6%.
### Market Reaction Equities have pulled back notably, with the S&P 500 and Nasdaq losing 2.7% and 3.4% respectively in recent sessions as risk sentiment cooled. Concurrently, upcoming earnings reports from infrastructure providers highlight heightened sensitivity to capital expenditure and cloud capacity trends.
### What It Means for Policy & Positioning Upcoming inflation prints and producer price data on Friday will heavily influence the Federal Reserve's path on interest rates. Investors are weighing whether sticky inflation readings will complicate monetary easing expectations while the technology sector absorbs data-centre spending concerns.
### Next Calendar Watch October U.S. inflation data is scheduled for release on Tuesday, followed by producer price data on Friday.
Read the full story
Original reporting and related coverage — attribution links only, not paid recommendations.
Trade this story
 Robinhood
 Webull
 Tradier
 IBKR
Chart this story
 TradingView
Broker and exchange buttons use invite / refer-a-friend links (rewards may be capped). Charting links (TradingView) are partner offers that may pay OppHub America a commission at no extra cost to you.
OppSHOP
Full OppSHOP →As an Amazon Associate, OppHub America earns from qualifying purchases. Shopping here helps keep the site free — at no extra cost to you. Disclosure

OppSHOP
Related to this story
Manage risk dynamically around upcoming inflation data prints and techno
Shop related →

Investing books
Read the classics
Shop this pick →

Personal finance books
Run the household books
Shop this pick →

Trading notebooks
Write the thesis first
Shop this pick →
Monitor for charts
See every pane
Shop this pick →
Story playbook
A pre-built map of what to watch — stocks, ETFs, and educational next steps. Not personalized advice.
Snapshot date: November 8, 2026 at 12:16 PM ET
This playbook was built when the story published and is not live-updated. Prices, news, and risk can change after this date — treat it as a starting map, not a current trade ticket.
Story → money map
Macro inflation and AI earnings
Tech stocks are dropping and inflation reports are coming out soon, which is making investors nervous. People who follow the market are watching closely to see if prices will keep falling or bounce back.
What changed
The Nasdaq entered correction territory amid mounting pressure on technology shares and incoming inflation data.
Who wins / who loses
Diversified asset holders and defensive sectors benefit from tech outflows, while AI infrastructure and high-growth equities take the brunt of the pullback.
Time horizon
Think in terms of the next few weeks.
Confidence & best fit
medium confidence · Active trader
Safer theme exposure (ETFs)
Baskets that own the theme without betting on one company.
Single stocks (higher risk)
Primary = closest to the story · Peers = same industry · Second-order = knock-on effects · Avoid = looks related but may be a trap
Primary
- $QQQWatch — track, don’t rush
Tracks the big tech companies that are currently dropping in price.
View $QQQ chart → · End-of-day delayed data
Peer
- $SPYWatch — track, don’t rush
Represents the overall stock market so you can see how all large companies are doing.
View $SPY chart → · End-of-day delayed data
Options (education only)
No strikes or expiries — a framework for how traders might express the view. Options can expire worthless.
Direction: volatile · Style: Protective put / downside hedge idea · Level: intermediate
Beginners should skip options during high volatility because prices move fast and can be unpredictable.
Income / OppHub America angle
Not a trade tip — ways to use the insight outside the market.
- Review cash allocations to prepare for buying opportunities if tech names overshoot to the downside.
What would break this thesis
- A sharp cooling in CPI inflation data paired with blowout AI earnings that instantly reverses the Nasdaq correction.
What to do next on OppHub America
Saved playbooks stay on this device for now.
Important
Not financial advice. OppHub America playbooks are educational market maps only — not recommendations to buy, sell, or hold any security. Markets move fast; information can be wrong or outdated. Trade and invest at your own risk. Do your own research or consult a licensed advisor.
Based on reporting from yahoo-tickers-tape-movers.
Informational and educational only — not investment, financial, or legal advice. Disclosure
Shares a vertical MP4 loop to your phone's camera roll or app share sheet (Instagram, TikTok, Facebook Reels).