Barry, OppHub America Desk · · Source: yahoo-tickers-tape-movers
QQQ Investor: $100k Growth Outlook Varies by Rate
- Investors weighing long-term growth potential for a $100,000 lump sum into QQQ should consider the wide range of outcomes based on historical performance versus lifetime averages. - A 22% annualized return, achieved over the last decade, projects $1 million by age 52, whereas QQQ's lifetime 11% average pushes that goal to age 63.
Based on reporting from yahoo-tickers-tape-movers.
Investors considering the Invesco QQQ Trust ($QQQ+WL) may see vastly different retirement outcomes depending on the assumed growth rate. While a 22% annualized return over the last decade could turn $100,000 into $1 million by age 52, a more conservative 11% lifetime average pushes that milestone to age 63.
Market context for this story
As of: Regular HoursLoading quotes…
Informational only — not investment advice. Full markets →


$QQQInvesco QQQ Trust
TradingView
Live chart & market data via TradingView · OppHub classroom · Delayed or exchange real-time per TradingView data agreements · Not investment advice
$AMZN
TradingView
Live chart & market data via TradingView · OppHub classroom · Delayed or exchange real-time per TradingView data agreements · Not investment advice
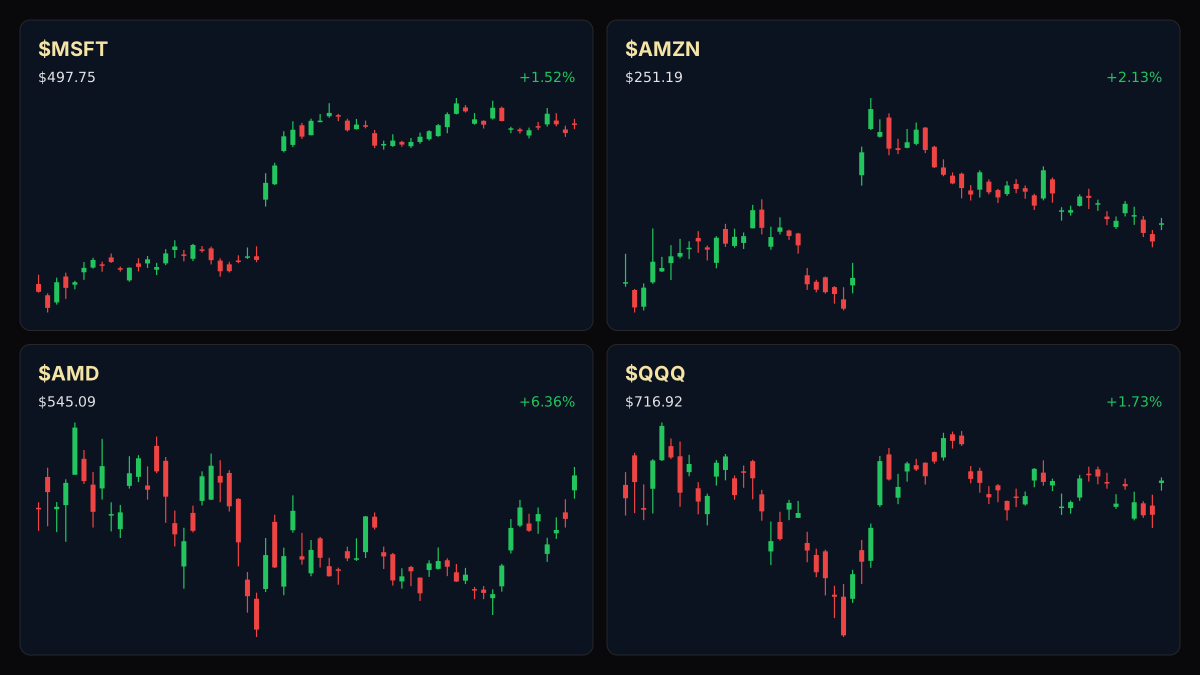
Educational TradingView charts — search any symbol in the widget. Confirm on /markets/QQQ and related $AMZN, $AMD, $MSFT. Not investment advice.
Related markets
Shares a vertical MP4 loop to your phone's camera roll or app share sheet (Instagram, TikTok, Facebook Reels).
Investors considering the Invesco QQQ Trust ($QQQ+WL) may see vastly different retirement outcomes depending on the assumed growth rate. While a 22% annualized return over the last decade could turn $100,000 into $1 million by age 52, a more conservative 11% lifetime average pushes that milestone to age 63.
The fund's significant gains over the past ten years, totaling roughly 501% and reaching $705, have been driven by a concentration in technology and growth sectors, including major holdings like NVIDIA (NASDAQ:NVDA), Apple (NASDAQ:AAPL), and Microsoft (NASDAQ:MSFT). However, this concentration, coupled with the exclusion of financial stocks, leaves the ETF exposed to potential downturns if mega-cap tech performance falters or semiconductor markets shift. A hypothetical 40% drawdown in an early investment year could significantly reset the compounding trajectory for lump-sum investors without consistent contributions.
Read the full story
Original reporting and related coverage — attribution links only, not paid recommendations.
Trade this story
 Robinhood
 Webull
 Tradier
 IBKR
IBKR
Chart this story
 TradingView
Broker and exchange buttons use invite / refer-a-friend links (rewards may be capped). Charting links (TradingView) are partner offers that may pay OppHub America a commission at no extra cost to you.
OppSHOP
Full OppSHOP →As an Amazon Associate, OppHub America earns from qualifying purchases. Shopping here helps keep the site free — at no extra cost to you. Disclosure

OppSHOP
Related to this story
- Investors weighing long-term growth potential for a $100,000 lump sum
Shop related →

Investing books
Read the classics
Shop this pick →

Personal finance books
Run the household books
Shop this pick →

Trading notebooks
Write the thesis first
Shop this pick →

Monitor for charts
See every pane
Shop this pick →
Story playbook
A pre-built map of what to watch — stocks, ETFs, and educational next steps. Not personalized advice.
Snapshot date: September 17, 2026 at 4:01 PM ET
This playbook was built when the story published and is not live-updated. Prices, news, and risk can change after this date — treat it as a starting map, not a current trade ticket.
Story → money map
tech growth concentration
How fast your retirement savings grow depends heavily on whether tech stocks keep booming like they did recently or slow down to normal averages. Experts look at this to help people plan how much money they will have when they stop working.
What changed
Analysis highlighted how varying annual return rates for the QQQ fund drastically shift the timeline for reaching a $1 million retirement milestone.
Who wins / who loses
Mega-cap tech stock holders benefit from high growth projections, while lump-sum investors face significant risks if early market drawdowns hit concentrated holdings.
Time horizon
Think in terms of the next few months.
Confidence & best fit
medium confidence · Long-term investor
Safer theme exposure (ETFs)
Baskets that own the theme without betting on one company.
Single stocks (higher risk)
Primary = closest to the story · Peers = same industry · Second-order = knock-on effects · Avoid = looks related but may be a trap
Primary
- $QQQWatch — track, don’t rush
The main basket of tech stocks discussed in the retirement growth article.
View $QQQ chart → · End-of-day delayed data
Peer
- $NVDABuild slowly — only if it fits your plan
A major artificial intelligence chip maker powering recent tech stock gains.
View $NVDA chart → · End-of-day delayed data
- $AAPLWatch — track, don’t rush
A massive technology company whose stock price heavily shapes retirement funds.
View $AAPL chart → · End-of-day delayed data
- $MSFTWatch — track, don’t rush
A leading software giant holding a large weight in popular tech indexes.
View $MSFT chart → · End-of-day delayed data
Options (education only)
No strikes or expiries — a framework for how traders might express the view. Options can expire worthless.
Direction: bullish · Style: Covered-call income (only if you already own shares) · Level: intermediate
Beginners should skip options; this is an advanced way to make extra money on stocks you already own, but it can limit your maximum gains.
Income / OppHub America angle
Not a trade tip — ways to use the insight outside the market.
- Setting up automated recurring investments to reduce the risk of lump-sum market timing errors.
What would break this thesis
- Prolonged structural decline in mega-cap technology earnings or sustained higher interest rates crushing growth valuations.
What to do next on OppHub America
Saved playbooks stay on this device for now.
Important
Not financial advice. OppHub America playbooks are educational market maps only — not recommendations to buy, sell, or hold any security. Markets move fast; information can be wrong or outdated. Trade and invest at your own risk. Do your own research or consult a licensed advisor.
Based on reporting from yahoo-tickers-tape-movers.
Informational and educational only — not investment, financial, or legal advice. Disclosure
Shares a vertical MP4 loop to your phone's camera roll or app share sheet (Instagram, TikTok, Facebook Reels).