Barry, OppHub America Desk · · Source: yahoo-megacap-tickers
S&P 500 CAPE Ratio Hits 41, Echoing Dot-Com Bubble
Focus on identifying quality stocks with long-term potential rather than chasing speculative growth stocks whose lofty valuations could leave them vulnerable in a downturn.
Based on reporting from yahoo-megacap-tickers.
The S&P 500's Cyclically Adjusted Price-to-Earnings (CAPE) ratio has reached 41, a level not seen since the dot-com bubble, signaling potential market exuberance and historical valuation risk. Investors are reminded to focus on quality stocks amid this historically expensive market.
Market context for this story
As of: WeekendLoading quotes…
Informational only — not investment advice. Full markets →

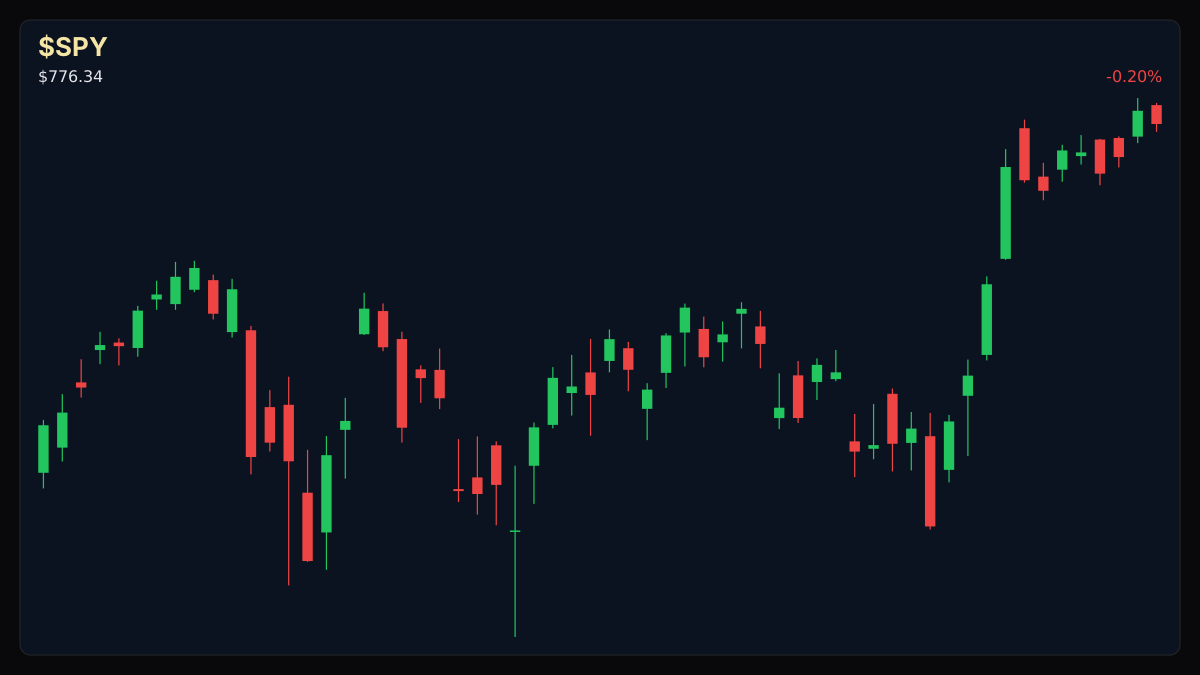
$SPYSPDR S&P 500 ETF
TradingView
Live chart & market data via TradingView · OppHub classroom · Delayed or exchange real-time per TradingView data agreements · Not investment advice
Educational TradingView chart — search any symbol in the widget. Confirm on /markets/SPY. Not investment advice.
Related markets
Shares a vertical MP4 loop to your phone's camera roll or app share sheet (Instagram, TikTok, Facebook Reels).
**Implied Volatility / Movement:** The S&P 500 (^GSPC) traded down 0.17%, the Dow Jones Industrial Average (^DJI) down 0.20%, and the Nasdaq Composite (^IXIC) down 0.28% on the day, though all remain up double digits year-to-date.
The stock market's valuation, as measured by the S&P 500's Cyclically Adjusted Price-to-Earnings (CAPE) ratio, has reached an historically significant level. Currently at approximately 41, this metric has only been surpassed once before, in the period preceding the dot-com bubble's collapse. This valuation metric, which compares current market prices to average inflation-adjusted earnings over the past decade, suggests the market may be in territory of extreme optimism and potentially overvaluation.
### Money Play If market sentiments remain positive, all three major indexes could end 2026 with their fourth consecutive year of double-digit annual returns. That hasn't happened since before the dot-com bubble popped in 2000. However, investors should focus on identifying quality stocks with long-term potential rather than chasing speculative growth stocks whose lofty valuations could leave them vulnerable in a downturn.
### Executive Thesis The current market valuation, with the CAPE ratio at 41, presents a historical anomaly comparable only to the dot-com era. While this does not guarantee an imminent crash, it suggests extreme optimism and a need for caution, particularly for investors focused on long-term portfolio resilience.
### The Print The S&P 500 (^GSPC) reported a daily change of -0.17%. The Dow Jones Industrial Average (^DJI) reported a daily change of -0.20%. The Nasdaq Composite (^IXIC) reported a daily change of -0.28%. Year-to-date, all three major indexes have posted double-digit gains.
### Market Reaction Futures for the S&P 500 (^GSPC) traded down 0.17% for the day. The Dow Jones Industrial Average (^DJI) futures traded down 0.20%. The Nasdaq Composite (^IXIC) futures traded down 0.28%.
### What It Means for Policy & Positioning While the CAPE ratio is a valuation metric and not directly tied to immediate Federal Reserve policy, sustained market exuberance at historical highs can influence risk sentiment. The Federal Reserve monitors broad financial conditions, and extreme valuations could indirectly factor into risk assessments.
### Next Calendar Watch No specific future data prints or Fed meetings were mentioned in the provided facts.
Read the full story
Original reporting and related coverage — attribution links only, not paid recommendations.
Trade this story
 Robinhood
 Webull
 Tradier
 IBKR
IBKR
Chart this story
 TradingView
Broker and exchange buttons use invite / refer-a-friend links (rewards may be capped). Charting links (TradingView) are partner offers that may pay OppHub America a commission at no extra cost to you.
OppSHOP
Full OppSHOP →As an Amazon Associate, OppHub America earns from qualifying purchases. Shopping here helps keep the site free — at no extra cost to you. Disclosure

OppSHOP
Related to this story
Focus on identifying quality stocks with long-term potential rather than
Shop related →

Investing books
Read the classics
Shop this pick →

Personal finance books
Run the household books
Shop this pick →

Trading notebooks
Write the thesis first
Shop this pick →

Monitor for charts
See every pane
Shop this pick →
Story playbook
A pre-built map of what to watch — stocks, ETFs, and educational next steps. Not personalized advice.
Snapshot date: August 16, 2026 at 1:56 AM ET
This playbook was built when the story published and is not live-updated. Prices, news, and risk can change after this date — treat it as a starting map, not a current trade ticket.
Story → money map
market valuation extremes
The stock market is currently priced at historic highs, similar to the massive bubble in the late 1990s. Experts suggest being careful and buying stable, reliable companies instead of risky, fast-growing stocks.
What changed
The S&P 500 Cyclically Adjusted Price-to-Earnings (CAPE) ratio reached 41, matching historic dot-com bubble levels.
Who wins / who loses
Defensive value stocks and steady dividend payers benefit from a flight to safety, while richly valued speculative growth stocks are vulnerable.
Time horizon
Think in terms of the next few months.
Confidence & best fit
medium confidence · Long-term investor
Safer theme exposure (ETFs)
Baskets that own the theme without betting on one company.
Single stocks (higher risk)
Primary = closest to the story · Peers = same industry · Second-order = knock-on effects · Avoid = looks related but may be a trap
Primary
- $SPYProtect — reduce risk
The main stock market fund is very expensive right now, so investors might want to buy insurance against a drop.
View $SPY chart → · End-of-day delayed data
Peer
- $QQQWatch — track, don’t rush
Tech stocks have led the market higher and carry the biggest risk if prices pull back.
View $QQQ chart → · End-of-day delayed data
Second-order
- $TLTBuild slowly — only if it fits your plan
Government bonds can act as a safe place to park money if stock prices start falling.
View $TLT chart → · End-of-day delayed data
- $XLFWatch — track, don’t rush
Bank stocks give a good read on how the broader economy is handling high market prices.
View $XLF chart → · End-of-day delayed data
Options (education only)
No strikes or expiries — a framework for how traders might express the view. Options can expire worthless.
Direction: volatile · Style: Protective put / downside hedge idea · Level: intermediate
Beginners should skip options here; buying insurance on expensive stocks can be costly and complicated.
Income / OppHub America angle
Not a trade tip — ways to use the insight outside the market.
- Focus on building cash reserves to take advantage of potential future market dips.
What would break this thesis
- Corporate earnings grow rapidly enough to justify elevated valuation multiples, preventing a major correction.
What to do next on OppHub America
Saved playbooks stay on this device for now.
Important
Not financial advice. OppHub America playbooks are educational market maps only — not recommendations to buy, sell, or hold any security. Markets move fast; information can be wrong or outdated. Trade and invest at your own risk. Do your own research or consult a licensed advisor.
Based on reporting from yahoo-megacap-tickers.
Informational and educational only — not investment, financial, or legal advice. Disclosure
Shares a vertical MP4 loop to your phone's camera roll or app share sheet (Instagram, TikTok, Facebook Reels).