Barry, OppHub America Desk · · Source: yahoo-tickers-tape-movers
S&P 500, Nasdaq Hit Records on AI Chip Rally
Energy and chip sector dynamics continue to drive divergent performance across asset classes. Investors are monitoring semiconductor demand vectors alongside shifting Treasury yields and consumer price pressures.
Based on reporting from yahoo-tickers-tape-movers.
U.S. equities climbed to record highs on Tuesday, October 6, 2026, as momentum in AI chipmakers countered persistent economic headwinds. The S&P 500 rose 0.58% to cross 7,800, driven by optimism around semiconductor demand and easing Treasury yields.
Market context for this story
As of: After HoursLoading quotes…
Informational only — not investment advice. Full markets →


$SPYSPDR S&P 500 ETF
TradingView
Live chart & market data via TradingView · OppHub classroom · Delayed or exchange real-time per TradingView data agreements · Not investment advice
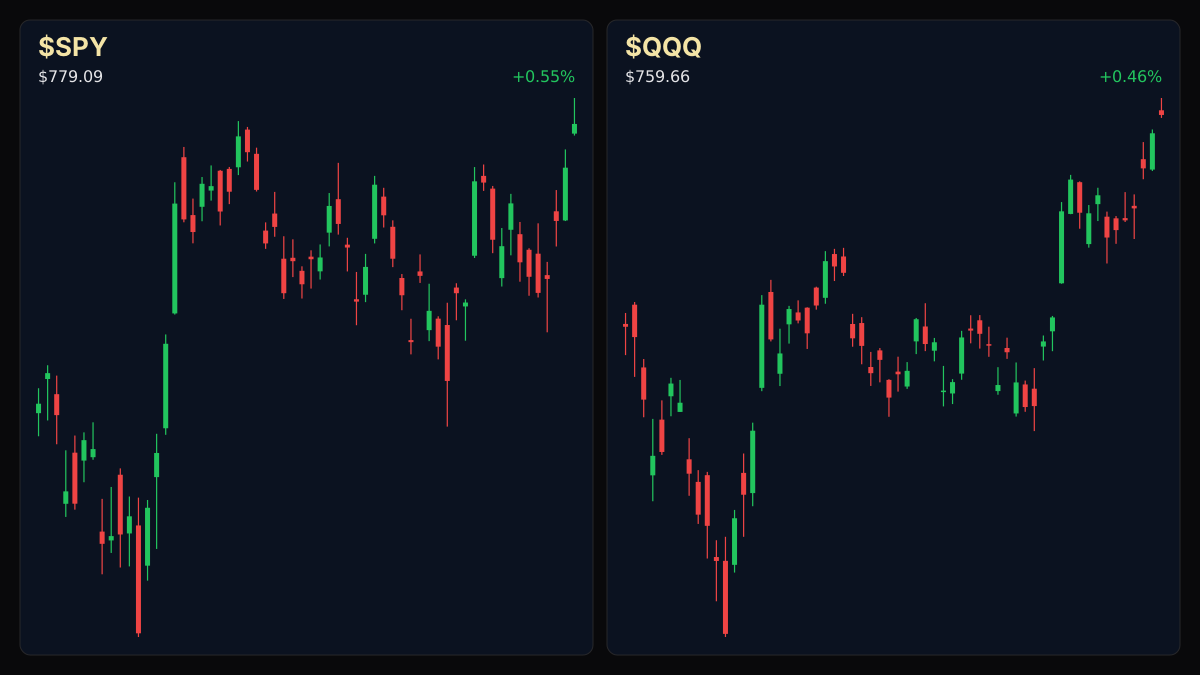
Educational TradingView chart — search any symbol in the widget. Confirm on /markets/SPY and related $QQQ. Not investment advice.
Related markets
Shares a vertical MP4 loop to your phone's camera roll or app share sheet (Instagram, TikTok, Facebook Reels).
U.S. equities advanced on Tuesday, October 6, 2026, as the S&P 500 rose 0.58% to top 7,800 for the first time in its history amid a broader rally in artificial intelligence semiconductor names.
### Executive Thesis The record-setting session reflects resilient investor enthusiasm for AI infrastructure plays, even as broader economic indicators flash warning signals. Wall Street sentiment is increasingly leaning toward the Federal Reserve holding interest rates steady at its upcoming October meeting following softer-than-expected September labor market data.
### The Print vs Consensus At Tuesday's close, the S&P 500 gained 0.58% to finish above 7,800. The tech-heavy Nasdaq Composite rose 0.45%, while the Dow Jones Industrial Average added 0.49%. Meanwhile, the 10-year U.S. Treasury yield touched 5.349% on Monday—its highest level since April 2022—before retreating during Tuesday's session.
### Market Reaction Equities shrugged off macroeconomic headwinds, including elevated bond market volatility and persistent cost pressures for American consumers. Energy expenses, while pulling back slightly over the prior week, remain substantially higher year-over-year, keeping cost-of-living concerns front and center ahead of upcoming political elections.
### What It Means for Policy & Positioning Softening September job figures and commentary from multiple central bank officials suggest the federal funds rate path may pause in October. Market participants continue to weigh high-yielding fixed income alternatives against equity multiple expansion fueled by ongoing capital expenditures in AI chip technologies.
### Next Calendar Watch Federal Reserve officials meet later in October to determine the path for benchmark interest rates.
Read the full story
Original reporting and related coverage — attribution links only, not paid recommendations.
Trade this story
 Robinhood
 Webull
 Tradier
 IBKR
IBKR
Chart this story
 TradingView
Broker and exchange buttons use invite / refer-a-friend links (rewards may be capped). Charting links (TradingView) are partner offers that may pay OppHub America a commission at no extra cost to you.
OppSHOP
Full OppSHOP →As an Amazon Associate, OppHub America earns from qualifying purchases. Shopping here helps keep the site free — at no extra cost to you. Disclosure

OppSHOP
Related to this story
Energy and chip sector dynamics continue to drive divergent performance
Shop related →

Investing books
Read the classics
Shop this pick →

Personal finance books
Run the household books
Shop this pick →

Trading notebooks
Write the thesis first
Shop this pick →

Monitor for charts
See every pane
Shop this pick →
Story playbook
A pre-built map of what to watch — stocks, ETFs, and educational next steps. Not personalized advice.
Snapshot date: October 6, 2026 at 5:31 PM ET
This playbook was built when the story published and is not live-updated. Prices, news, and risk can change after this date — treat it as a starting map, not a current trade ticket.
Story → money map
AI chips and market records
The stock market hit record highs because investors are still very excited about artificial intelligence technology. Even though the broader economy has some problems like high interest rates, tech companies are pushing prices up.
What changed
S&P 500 and Nasdaq hit record highs fueled by AI semiconductor momentum and easing Treasury yields.
Who wins / who loses
AI chipmakers and tech indexes benefit from strong demand, while broader consumer-facing sectors face ongoing cost pressures and bond market volatility.
Time horizon
Think in terms of the next few weeks.
Confidence & best fit
medium confidence · Long-term investor, Active trader
Safer theme exposure (ETFs)
Baskets that own the theme without betting on one company.
- $SMH — A basket of semiconductor stocks that lets you invest in the entire chip industry rather than just one company.
- $QQQ — A fund holding the top 100 technology companies, capturing the broader market momentum safely.
- $SPY — A fund that tracks the overall U.S. stock market so you don't have to pick individual winners.
Single stocks (higher risk)
Primary = closest to the story · Peers = same industry · Second-order = knock-on effects · Avoid = looks related but may be a trap
Primary
- $NVDABuild slowly — only if it fits your plan
The leading maker of artificial intelligence chips that are driving the current stock market rally.
View $NVDA chart → · End-of-day delayed data
Peer
- $AMDWatch — track, don’t rush
A major competitor in the chip market that often moves alongside industry leaders.
View $AMD chart → · End-of-day delayed data
Second-order
- $MSFTWatch — track, don’t rush
A massive tech company spending heavily on AI and benefiting from the technology boom.
View $MSFT chart → · End-of-day delayed data
Options (education only)
No strikes or expiries — a framework for how traders might express the view. Options can expire worthless.
Direction: bullish · Style: Debit spread (defined risk) · Level: intermediate
Beginners should generally skip options here due to high volatility; stick to buying shares or ETFs instead.
Income / OppHub America angle
Not a trade tip — ways to use the insight outside the market.
- Look into localized semiconductor supply chain logistics and data center real estate investment trusts.
What would break this thesis
- A sharp, sustained spike in Treasury yields or worse-than-expected inflation reports could derail the equity rally.
What to do next on OppHub America
Saved playbooks stay on this device for now.
Important
Not financial advice. OppHub America playbooks are educational market maps only — not recommendations to buy, sell, or hold any security. Markets move fast; information can be wrong or outdated. Trade and invest at your own risk. Do your own research or consult a licensed advisor.
Based on reporting from yahoo-tickers-tape-movers.
Informational and educational only — not investment, financial, or legal advice. Disclosure
Shares a vertical MP4 loop to your phone's camera roll or app share sheet (Instagram, TikTok, Facebook Reels).