OppHub America Desk · · Source: yahoo-tickers-tape-movers
S&P 500 Slides 1.96% As Broad Equity Tape Hits Volatility Spike
Monitor risk parameters and liquidity depth closely across major equity indices as volatility expands.
Based on reporting from yahoo-tickers-tape-movers.
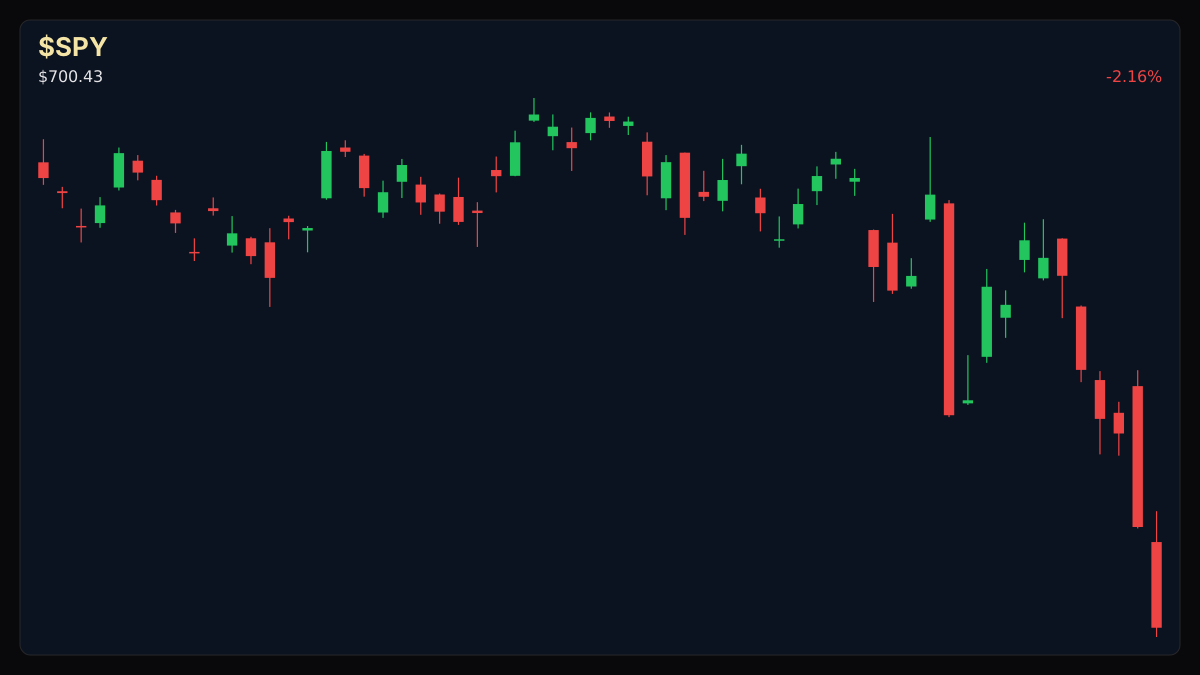
Major U.S. indexes retreated sharply on Friday, November 20, 2026, as the S&P 500 dropped 1.96% to 7,035.51 alongside a surge in the VIX volatility gauge. Traders are recalibrating risk exposure across growth sectors and major asset classes amid shifting tape momentum.
Market context for this story
As of: Regular HoursLoading quotes…
Informational only — not investment advice. Full markets →
 SPDR S&P 500 ETF·$SPY
$SPYSPDR S&P 500 ETF
TradingView
Live chart & market data via TradingView · OppHub classroom · Delayed or exchange real-time per TradingView data agreements · Not investment advice
Educational TradingView chart — search any symbol in the widget. Confirm on /markets/SPY. Not investment advice.
Related markets
Shares a vertical MP4 loop to your phone's camera roll or app share sheet (Instagram, TikTok, Facebook Reels).
### Tape / Session Read Major U.S. benchmarks faced broad-based selling pressure on Friday, November 20, 2026. The S&P 500 declined 1.96% (-140.32 points) to 7,035.51, while the tech-heavy Nasdaq tumbled 3.28% (-783.33 points) to 23,095.87. The Dow Jones Industrial Average held relatively resilient with a 0.49% loss (-240.71 points) to 48,856.35, and the Russell 2000 small-cap index retreated 1.74% (-46.14 points) to 2,608.97. Meanwhile, market volatility spiked significantly, with the Cboe Volatility Index (VIX) surging 12.24% (+3.49 points) to 31.93.
### Why This Lane Matters The sharp divergence and downside acceleration across large-cap tech and broader equities signal a rapid contraction in risk appetite. Investors are reassessing high-growth valuations as defensive rotation takes hold, impacting cross-asset liquidity and index-level support structures.
### Money Play Market participants navigating current tape conditions should monitor risk parameters and liquidity depth closely across major equity indices as volatility expands.
## S&P 500 Technical Analysis & Key Risk Watch — Regular Session
77.54 · R1 ## S&P 500 Technical Analysis & Key Risk Watch — Regular Session 63.20 · last ## S&P 500 Technical Analysis & Key Risk Watch — Regular Session 56.14 · S1 ## S&P 500 Technical Analysis & Key Risk Watch — Regular Session 55.01 · S2 ## S&P 500 Technical Analysis & Key Risk Watch — Regular Session 48.80.
As the broad market absorbs sharp downside pressure with the S&P 500 testing the 7,035.51 handle, traders are closely watching institutional support zones and volatility expansion metrics for signs of stabilization or deeper retracement.
Read the full story
Original reporting and related coverage — attribution links only, not paid recommendations.
Trade this story
 Robinhood
 Webull
 Tradier
 IBKR
Chart this story
 TradingView
Broker and exchange buttons use invite / refer-a-friend links (rewards may be capped). Charting links (TradingView) are partner offers that may pay OppHub America a commission at no extra cost to you.
OppSHOP
Full OppSHOP →As an Amazon Associate, OppHub America earns from qualifying purchases. Shopping here helps keep the site free — at no extra cost to you. Disclosure

OppSHOP
Related to this story
Monitor risk parameters and liquidity depth closely across major equity
Shop related →

Investing books
Read the classics
Shop this pick →

Personal finance books
Run the household books
Shop this pick →

Trading notebooks
Write the thesis first
Shop this pick →

Monitor for charts
See every pane
Shop this pick →
Based on reporting from yahoo-tickers-tape-movers.
Informational and educational only — not investment, financial, or legal advice. Disclosure
Shares a vertical MP4 loop to your phone's camera roll or app share sheet (Instagram, TikTok, Facebook Reels).