Barry, OppHub America Desk · · Source: yahoo-tickers-tape-movers
Trump Presidency & Stock Market: 85 Years of Precedent
Tariffs & trade: Tariffs hit importers/retail and can lift domestic industrials; China ADRs sensitive.
Based on reporting from yahoo-tickers-tape-movers.
Historical data spanning over 85 years suggests that major stock indexes have historically performed positively under presidential terms marked by significant geopolitical events. Despite volatility, the S&P 500 has shown median gains following such shocks, offering a counterpoint to fears of an imminent market crash.
Market context for this story
As of: WeekendLoading quotes…
Informational only — not investment advice. Full markets →

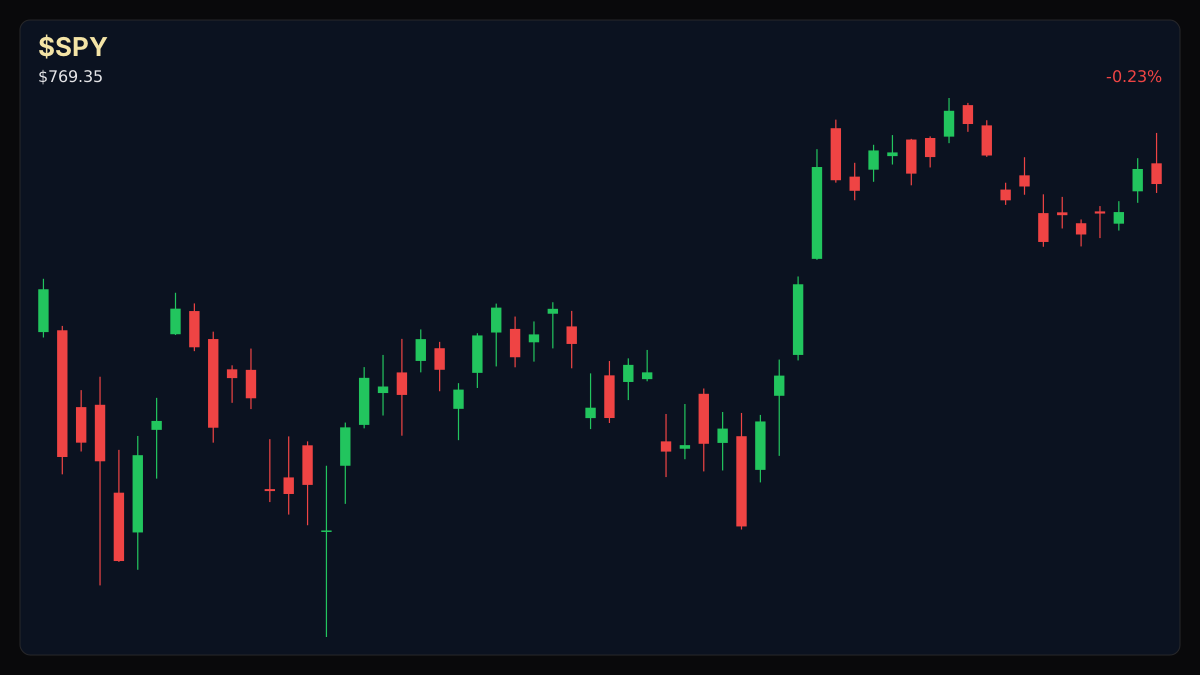
$SPYSPDR S&P 500 ETF
TradingView
Live chart & market data via TradingView · OppHub classroom · Delayed or exchange real-time per TradingView data agreements · Not investment advice
Educational TradingView chart — search any symbol in the widget. Confirm on /markets/SPY. Not investment advice.
Related markets
Shares a vertical MP4 loop to your phone's camera roll or app share sheet (Instagram, TikTok, Facebook Reels).
**Implied Volatility / Movement:**
Historical analysis of presidential terms and market performance indicates a tendency for stock indexes to advance, even amid significant geopolitical events. Over the past 85 years, the Dow Jones Industrial Average, S&P 500, and Nasdaq Composite have shown notable gains during terms marked by global shocks.
During President Donald Trump's first term, the Dow Jones Industrial Average, S&P 500, and Nasdaq Composite rallied 57%, 70%, and 142%, respectively. Since his second-term inauguration, these indexes have additionally gained 23%, 28%, and 32%, respectively. This performance outpaces many historical presidencies.
However, these gains have not been without volatility. Significant events such as the COVID-19 crash, where the S&P 500 shed 34% in 33 days, and the "tariff tantrum" which saw the S&P 500 lose over 10% in two trading sessions, highlight periods of sharp decline. Despite these volatile episodes, data compiled from over three dozen stock market shock events since 1940 suggests that the S&P 500 has historically gained a median of 3% one year after a shock event began, with positive returns occurring in 65% of such instances. This historical precedent suggests that an imminent market crash is not a foregone conclusion, although periods of elevated volatility remain a recurring theme.
Read the full story
Original reporting and related coverage — attribution links only, not paid recommendations.
Trade this story
 Robinhood
 Webull
 Tradier
 IBKR
IBKR
Chart this story
 TradingView
Broker and exchange buttons use invite / refer-a-friend links (rewards may be capped). Charting links (TradingView) are partner offers that may pay OppHub America a commission at no extra cost to you.
OppSHOP
Full OppSHOP →As an Amazon Associate, OppHub America earns from qualifying purchases. Shopping here helps keep the site free — at no extra cost to you. Disclosure

OppSHOP
Related to this story
Tariffs & trade: Tariffs hit importers/retail and can lift domestic indu
Shop related →

Investing books
Read the classics
Shop this pick →

Personal finance books
Run the household books
Shop this pick →

Trading notebooks
Write the thesis first
Shop this pick →

Monitor for charts
See every pane
Shop this pick →
Story playbook
A pre-built map of what to watch — stocks, ETFs, and educational next steps. Not personalized advice.
Snapshot date: August 30, 2026 at 4:56 AM ET
This playbook was built when the story published and is not live-updated. Prices, news, and risk can change after this date — treat it as a starting map, not a current trade ticket.
Story → money map
presidential cycle trade policy
History shows the stock market usually goes up over time even after major scary events happen. People who manage money pay attention to this so they don't panic when tariffs or news cause short-term drops.
What changed
Analysis of 85 years of presidential terms and market shocks reveals resilient median forward returns despite headline volatility.
Who wins / who loses
Domestic manufacturers and industrials benefit from protective trade policies, while retail and import-heavy sectors face margin pressure.
Time horizon
Think in terms of the next few months.
Confidence & best fit
medium confidence · Long-term investor, Active trader
Safer theme exposure (ETFs)
Baskets that own the theme without betting on one company.
Single stocks (higher risk)
Primary = closest to the story · Peers = same industry · Second-order = knock-on effects · Avoid = looks related but may be a trap
Primary
- $XLIBuild slowly — only if it fits your plan
Companies that build things inside the US could do well if foreign goods cost more.
View $XLI chart → · End-of-day delayed data
Second-order
- $XRTProtect — reduce risk
Stores that import a lot of cheap goods might struggle with higher taxes on imports.
View $XRT chart → · End-of-day delayed data
Options (education only)
No strikes or expiries — a framework for how traders might express the view. Options can expire worthless.
Direction: volatile · Style: Protective put / downside hedge idea · Level: intermediate
Think of this like buying insurance for your stock portfolio in case the market drops suddenly. Beginners should skip this and stick to simple investing.
Income / OppHub America angle
Not a trade tip — ways to use the insight outside the market.
- Review supply chain dependencies to identify businesses with local manufacturing footprints.
What would break this thesis
- A severe, prolonged trade war that triggers an earnings recession or inflation spiral.
What to do next on OppHub America
Saved playbooks stay on this device for now.
Important
Not financial advice. OppHub America playbooks are educational market maps only — not recommendations to buy, sell, or hold any security. Markets move fast; information can be wrong or outdated. Trade and invest at your own risk. Do your own research or consult a licensed advisor.
Based on reporting from yahoo-tickers-tape-movers.
Informational and educational only — not investment, financial, or legal advice. Disclosure
Shares a vertical MP4 loop to your phone's camera roll or app share sheet (Instagram, TikTok, Facebook Reels).