Barry, OppHub America Desk · · Source: yahoo-big4-etfs
US Budget Deficit Swells to $432.3B in July; Tax Cut Ideas Emerge
While specific investment vehicles were not S. budget deficit and potential for new tax cuts suggest a complex fiscal environment.
Based on reporting from yahoo-big4-etfs.
The U.S. budget deficit surged to $432.3 billion in July, marking the largest monthly shortfall since March 2021. This widening gap occurs as the administration reportedly considers new tax cut proposals, potentially impacting fiscal policy and market sentiment.
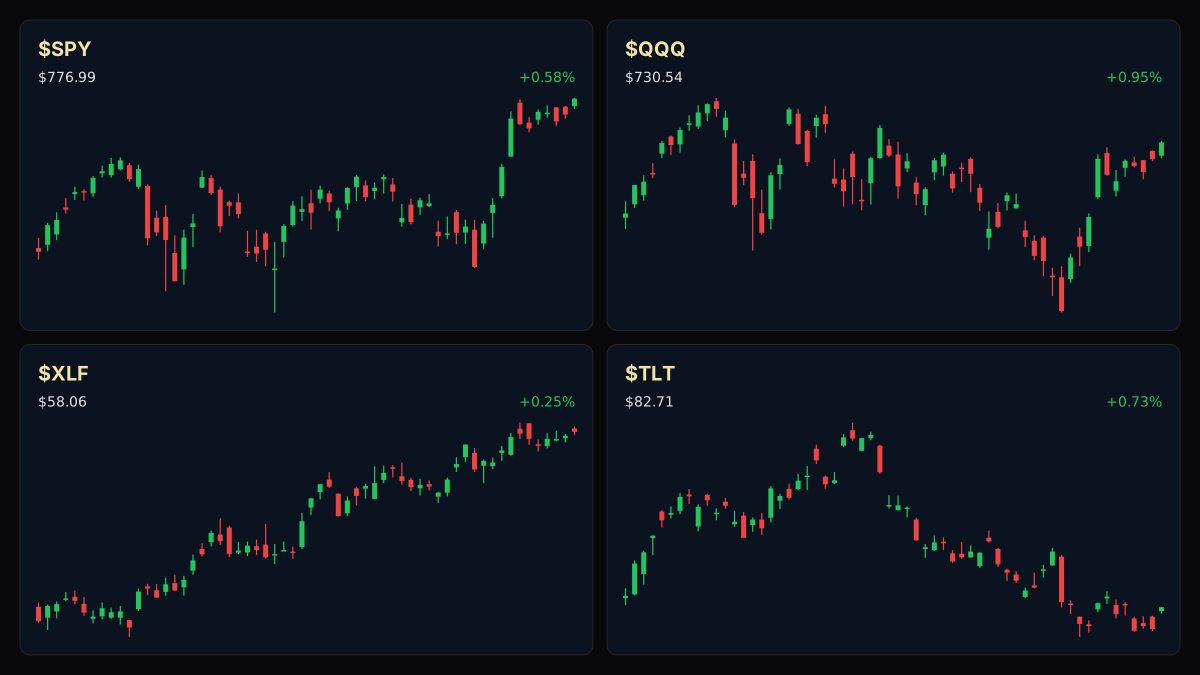
Market context for this story
As of: Regular HoursLoading quotes…
Informational only — not investment advice. Full markets →
 SPDR S&P 500 ETF·$SPY
 Invesco QQQ Trust·$QQQ
 iShares 20+ Year Treasury·$TLT
 Financial Select Sector·$XLF
$SPYSPDR S&P 500 ETF
TradingView
Live chart & market data via TradingView · OppHub classroom · Delayed or exchange real-time per TradingView data agreements · Not investment advice
$QQQInvesco QQQ Trust
TradingView
Live chart & market data via TradingView · OppHub classroom · Delayed or exchange real-time per TradingView data agreements · Not investment advice
Educational TradingView charts — search any symbol in the widget. Confirm on /markets/SPY and related $QQQ, $TLT, $XLF. Not investment advice.
Related markets
Shares a vertical MP4 loop to your phone's camera roll or app share sheet (Instagram, TikTok, Facebook Reels).
### Money Play While specific investment vehicles were not S. budget deficit and potential for new tax cuts suggest a complex fiscal environment.
### Executive Thesis The U.S. faces a widening budget deficit, driven by increased outlays and potentially influenced by proposed tax reductions. This fiscal trend occurs against a backdrop of elevated interest rates, impacting bond and real estate valuations, and may constrain future policy options.
### The Print In July, the U.S. Treasury reported a budget deficit of $432.3 billion, representing the largest monthly deficit observed since March 2021. This figure arose from $334 billion in receipts against $766 billion in outlays. Year-to-date, the federal deficit has reached $1.799 trillion.
### Market Reaction Major U.S. equity indices showed mixed performance on the reporting date, with the S&P 500 up 0.59%, the Dow Jones Industrial Average up 0.22%, and the Nasdaq 100 up 1.08%. The Russell 2000 gained 0.42%, while the international FTSE 100 declined 0.55% and the Nikkei 225 rose 0.57%.
### What It Means for Policy & Positioning The substantial July deficit, exacerbated by accelerated payments for certain government programs, highlights ongoing fiscal pressures. The contemplation of new tax cuts by the administration adds another layer of fiscal uncertainty, potentially widening the deficit further and influencing future monetary policy considerations by the Federal Reserve.
### Next Calendar Watch The next Monthly Treasury Statement detailing U.S. budget figures is anticipated in September 2026.
Read the full story
Original reporting and related coverage — attribution links only, not paid recommendations.
Trade this story (crypto)
 Coinbase
 Gemini
 Robinhood
 Webull
Chart this story
 TradingView
Broker and exchange buttons use invite / refer-a-friend links (rewards may be capped). Charting links (TradingView) are partner offers that may pay OppHub America a commission at no extra cost to you.
OppSHOP
Full OppSHOP →As an Amazon Associate, OppHub America earns from qualifying purchases. Shopping here helps keep the site free — at no extra cost to you. Disclosure

OppSHOP
Related to this story
While specific investment vehicles were not S. budget deficit and potent
Shop related →

Investing books
Read the classics
Shop this pick →

Personal finance books
Run the household books
Shop this pick →

Trading notebooks
Write the thesis first
Shop this pick →

Monitor for charts
See every pane
Shop this pick →
Story playbook
A pre-built map of what to watch — stocks, ETFs, and educational next steps. Not personalized advice.
Snapshot date: August 13, 2026 at 9:55 AM ET
This playbook was built when the story published and is not live-updated. Prices, news, and risk can change after this date — treat it as a starting map, not a current trade ticket.
Story → money map
U.S. fiscal deficit and debt supply
The U.S. government spent way more money than it collected in taxes last month, pushing the national deficit higher. Investors care because more government debt can push interest rates around and affect the entire stock market.
What changed
U.S. monthly budget deficit surged to $432.3 billion, the largest shortfall since March 2021.
Who wins / who loses
Treasury bond holders face potential pressure from increased debt supply, while fiscal stimulus from tax cuts could benefit broader equities.
Time horizon
Think in terms of the next few months.
Confidence & best fit
medium confidence · Long-term investor
Safer theme exposure (ETFs)
Baskets that own the theme without betting on one company.
Single stocks (higher risk)
Primary = closest to the story · Peers = same industry · Second-order = knock-on effects · Avoid = looks related but may be a trap
Primary
- $TLTProtect — reduce risk
When the government borrows more money, bond prices often drop, which hurts long-term bond holders.
View $TLT chart → · End-of-day delayed data
Second-order
- $XLFWatch — track, don’t rush
Banks and financial firms are sensitive to how government borrowing affects interest rates.
View $XLF chart → · End-of-day delayed data
Options (education only)
No strikes or expiries — a framework for how traders might express the view. Options can expire worthless.
Direction: volatile · Style: Protective put / downside hedge idea · Level: intermediate
Beginners should skip options here as macro deficit news is unpredictable and can cause choppy price swings.
Income / OppHub America angle
Not a trade tip — ways to use the insight outside the market.
- Monitor upcoming Treasury refunding announcements and Congressional tax proposals.
What would break this thesis
- A sudden bipartisan agreement on aggressive deficit reduction measures or unexpected surges in tax receipts.
What to do next on OppHub America
Saved playbooks stay on this device for now.
Important
Not financial advice. OppHub America playbooks are educational market maps only — not recommendations to buy, sell, or hold any security. Markets move fast; information can be wrong or outdated. Trade and invest at your own risk. Do your own research or consult a licensed advisor.
Based on reporting from yahoo-big4-etfs.
Informational and educational only — not investment, financial, or legal advice. Disclosure
Shares a vertical MP4 loop to your phone's camera roll or app share sheet (Instagram, TikTok, Facebook Reels).