Barry, OppHub America Desk · · Source: yahoo-megacap-tickers
U.S. Index Breadth Today: S&P 500 Rises 0.31%, Dow Up 1.14%
If market volatility continues with varied sector performance, watch broad market index ETFs like (S&P 500) and (Nasdaq 100) for potential shifts in underlying sector leadership. Not financial advice.
Based on reporting from yahoo-megacap-tickers.
U.S. equity markets are showing mixed sentiment today, Thursday, August 6, with the S&P 500 up 0.31% and the Dow Jones advancing 1.14%. This comes as specific software stocks exhibit significant divergence, with some rallying on strong earnings and others declining despite beating estimates.
Market context for this story
As of: Regular HoursLoading quotes…
Informational only — not investment advice. Full markets →


$SPYSPDR S&P 500 ETF
TradingView
Live chart & market data via TradingView · OppHub classroom · Delayed or exchange real-time per TradingView data agreements · Not investment advice
$STLA
TradingView
Live chart & market data via TradingView · OppHub classroom · Delayed or exchange real-time per TradingView data agreements · Not investment advice
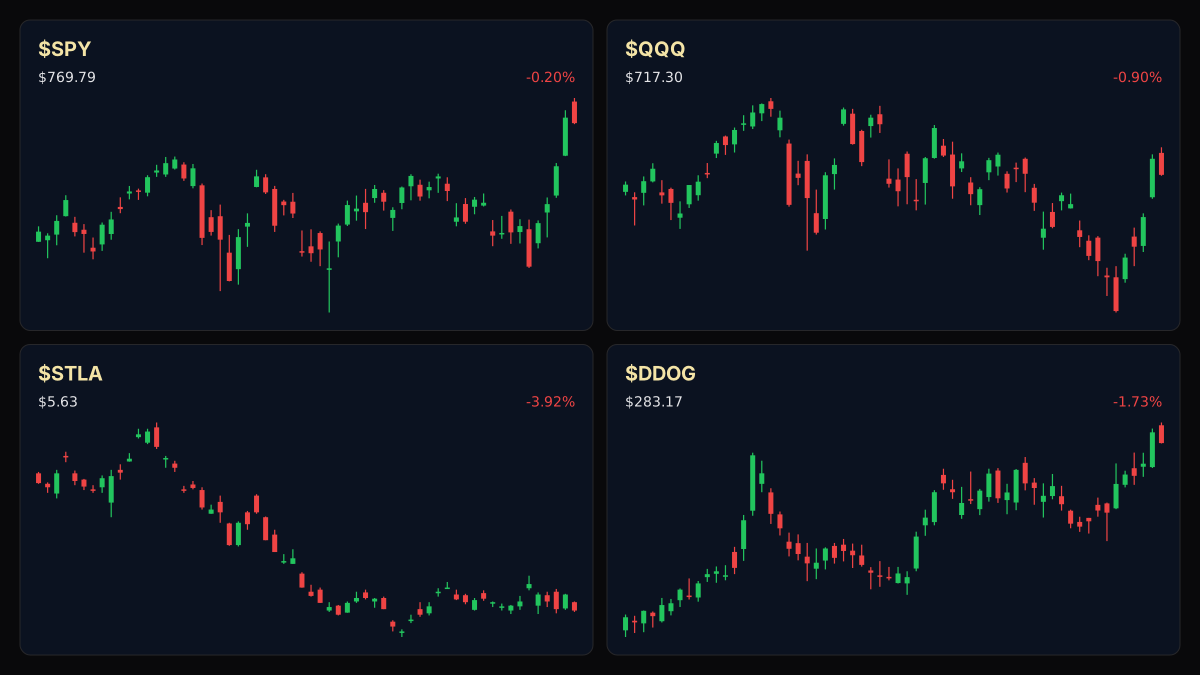
Educational TradingView charts — search any symbol in the widget. Confirm on /markets/SPY and related $STLA, $DDOG, $QQQ. Not investment advice.
Related markets
Shares a vertical MP4 loop to your phone's camera roll or app share sheet (Instagram, TikTok, Facebook Reels).
Implied Volatility / Movement: While major indices show modest gains, individual software stocks are experiencing significant moves, including SoundHound AI (NASDAQ: SOUN) up 12%, Unity Software (NYSE: U) up 11%, and Datadog (NASDAQ: DDOG) down 15%, indicating high single-stock volatility within the broader market.
### Tape / Session Read Today, Thursday, August 6, the S&P 500 has climbed 0.31%, while the Dow Jones Industrial Average has gained 1.14%. The Nasdaq 100 is up 0.99%, and the Russell 2000 has seen an increase of 0.37%. International benchmarks also registered gains, with the FTSE 100 rising 0.20% and the Nikkei 225 advancing 1.28%.
### Why This Lane Matters These movements reflect a nuanced session for U.S. markets, where overall index performance is positive but sector-specific and individual stock reactions to earnings reports are highly differentiated. This suggests investors are selectively re-evaluating valuations and growth prospects within various segments, particularly in software, rather than applying a broad market sentiment.
### Money Play If market volatility continues with varied sector performance, watch broad market index ETFs like $SPY+WL (S&P 500) and $QQQ+WL (Nasdaq 100) for potential shifts in underlying sector leadership. Not financial advice.
## S&P 500 Technical Analysis & Key Risk Watch — LIVE MARKET CONTEXT
Read the full story
Original reporting and related coverage — attribution links only, not paid recommendations.
Trade this story
 Robinhood
 Webull
 Tradier
 IBKR
IBKR
Chart this story
 TradingView
Broker and exchange buttons use invite / refer-a-friend links (rewards may be capped). Charting links (TradingView) are partner offers that may pay OppHub America a commission at no extra cost to you.
OppSHOP
Full OppSHOP →As an Amazon Associate, OppHub America earns from qualifying purchases. Shopping here helps keep the site free — at no extra cost to you. Disclosure

OppSHOP
Related to this story
If market volatility continues with varied sector performance, watch bro
Shop related →

Investing books
Read the classics
Shop this pick →

Personal finance books
Run the household books
Shop this pick →

Trading notebooks
Write the thesis first
Shop this pick →

Monitor for charts
See every pane
Shop this pick →
Story playbook
A pre-built map of what to watch — stocks, ETFs, and educational next steps. Not personalized advice.
Snapshot date: August 6, 2026 at 10:36 AM ET
This playbook was built when the story published and is not live-updated. Prices, news, and risk can change after this date — treat it as a starting map, not a current trade ticket.
Story → money map
software earnings divergence
The stock market went up a little bit overall, but individual tech companies are swinging wildly up and down based on their earnings reports. Investors care because this makes picking individual stocks risky, favoring broad market funds instead.
What changed
Major indices advanced led by the Dow while software stocks showed extreme divergence after earnings.
Who wins / who loses
Strong earnings reporters and cyclical value stocks win, while high-flying software names with mixed reactions lose.
Time horizon
Think in terms of the next few weeks.
Confidence & best fit
medium confidence · Long-term investor, Active trader
Safer theme exposure (ETFs)
Baskets that own the theme without betting on one company.
Single stocks (higher risk)
Primary = closest to the story · Peers = same industry · Second-order = knock-on effects · Avoid = looks related but may be a trap
Primary
- $SOUNWatch — track, don’t rush
This company's stock jumped after sharing its financial results.
View $SOUN chart → · End-of-day delayed data
- $DDOGWatch — track, don’t rush
Even though this company did well, investors expected even more and sold their shares.
View $DDOG chart → · End-of-day delayed data
Options (education only)
No strikes or expiries — a framework for how traders might express the view. Options can expire worthless.
Beginners should skip options here because individual tech stocks are bouncing around too unpredictably after earnings reports.
See options-friendly brokers →Income / OppHub America angle
Not a trade tip — ways to use the insight outside the market.
- Review software sector allocations in retirement portfolios to manage concentration risk.
What would break this thesis
- Broader market indices breaking trend downwards or a systemic sell-off across all technology sectors.
What to do next on OppHub America
Saved playbooks stay on this device for now.
Important
Not financial advice. OppHub America playbooks are educational market maps only — not recommendations to buy, sell, or hold any security. Markets move fast; information can be wrong or outdated. Trade and invest at your own risk. Do your own research or consult a licensed advisor.
Based on reporting from yahoo-megacap-tickers.
Informational and educational only — not investment, financial, or legal advice. Disclosure
Shares a vertical MP4 loop to your phone's camera roll or app share sheet (Instagram, TikTok, Facebook Reels).