Barry, OppHub America Desk · · Source: yahoo-tickers-tape-movers
Vanguard S&P 500 ETF Tech Concentration: Growth vs. Risk
Index concentration dynamics demand careful portfolio review across broad asset allocation models without relying on single-sector momentum.
Based on reporting from yahoo-tickers-tape-movers.
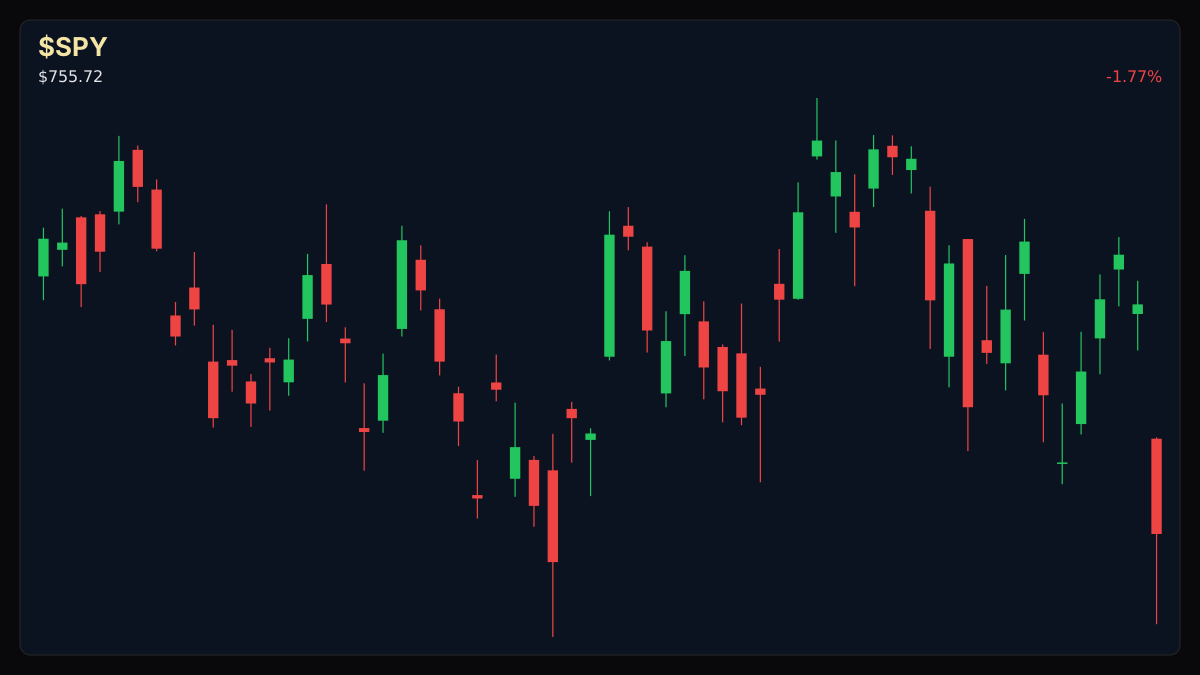
As broad equity indices navigate historic tech concentration, market participants weigh whether index-heavy weights pose structural vulnerabilities or continued long-term upside. The S&P 500 Index recently moved down 1.82% to 7,580.07, while the Vanguard S&P 500 ETF retreated 1.77% amid ongoing debates over tech dominance.
Market context for this story
As of: WeekendLoading quotes…
Informational only — not investment advice. Full markets →
 SPDR S&P 500 ETF·$SPY
$SPYSPDR S&P 500 ETF
TradingView
Live chart & market data via TradingView · OppHub classroom · Delayed or exchange real-time per TradingView data agreements · Not investment advice
Educational TradingView chart — search any symbol in the widget. Confirm on /markets/SPY. Not investment advice.
Related markets
Shares a vertical MP4 loop to your phone's camera roll or app share sheet (Instagram, TikTok, Facebook Reels).
### Session Tape — Weekend Index & Equity Review - **S&P 500 Index (^GSPC):** $7,580.07 (-1.82% / -$140.32) - **Vanguard S&P 500 ETF (VOO):** -1.77% (-$12.51) - **NASDAQ Composite:** 25,437.00 (-2.9% / -747.73) - **Dow Jones Industrial Average:** 51,770.31 (-1.1% / -572.25)
## Catalyst Analysis: Concentration Risks in Broad Index Funds Market debate centers on structural concentration as top holdings command unprecedented weight within flagship vehicles. Technology equities account for roughly 40% of the index, with the top 10 positions representing a similarly outsized share of total market capitalization. While this heavy weighting has historically driven compounding returns during secular tech rallies, it exposes passive portfolios to amplified drawdowns when sector momentum reverses.
## Market Structure & Historical Drawdowns Long-term allocators examining broad index products face recurring historical cycles where growth concentration leads to cyclical consolidation. Market history indicates that periodic pullbacks ranging from 20% to 30% remain standard features of equity ownership. The index's built-in reconstitution mechanism allows underlying components to evolve over time, yet short-term volatility hinges directly on mega-cap performance.
### Money Play Market positioning around index concentration remains neutral as participants evaluate portfolio diversification and long-term asset allocation models.
Read the full story
Original reporting and related coverage — attribution links only, not paid recommendations.
Trade this story (crypto)
 Coinbase
 Gemini
 Robinhood
 Webull
Chart this story
 TradingView
Broker and exchange buttons use invite / refer-a-friend links (rewards may be capped). Charting links (TradingView) are partner offers that may pay OppHub America a commission at no extra cost to you.
OppSHOP
Full OppSHOP →As an Amazon Associate, OppHub America earns from qualifying purchases. Shopping here helps keep the site free — at no extra cost to you. Disclosure

OppSHOP
Related to this story
Index concentration dynamics demand careful portfolio review across broa
Shop related →

Investing books
Read the classics
Shop this pick →

Personal finance books
Run the household books
Shop this pick →

Trading notebooks
Write the thesis first
Shop this pick →

Monitor for charts
See every pane
Shop this pick →
Story playbook
A pre-built map of what to watch — stocks, ETFs, and educational next steps. Not personalized advice.
Snapshot date: November 1, 2026 at 3:06 PM ET
This playbook was built when the story published and is not live-updated. Prices, news, and risk can change after this date — treat it as a starting map, not a current trade ticket.
Story → money map
Index concentration risk
The stock market went down because a few giant technology companies make up too much of the main indexes. Regular investors care because if tech stocks drop, their whole retirement account drops with them.
What changed
Broad market indices like the S&P 500 pulled back amid growing anxiety over extreme technology sector concentration.
Who wins / who loses
Diversified value and defensive sectors benefit from rotation, while mega-cap tech heavyweights suffer during sector pullbacks.
Time horizon
Think in terms of the next few months.
Confidence & best fit
medium confidence · Long-term investor
Safer theme exposure (ETFs)
Baskets that own the theme without betting on one company.
Single stocks (higher risk)
Primary = closest to the story · Peers = same industry · Second-order = knock-on effects · Avoid = looks related but may be a trap
Primary
- $VOOWatch — track, don’t rush
The main fund people use to track the stock market, which currently holds a huge amount of tech stocks.
View $VOO chart → · End-of-day delayed data
Peer
- $QQQProtect — reduce risk
A tech-heavy fund that swings up and down much faster than the wider market.
View $QQQ chart → · End-of-day delayed data
Second-order
- $RSPBuild slowly — only if it fits your plan
An index fund that gives every company an equal vote instead of letting giant tech firms dominate.
View $RSP chart → · End-of-day delayed data
Options (education only)
No strikes or expiries — a framework for how traders might express the view. Options can expire worthless.
Direction: volatile · Style: Protective put / downside hedge idea · Level: intermediate
Buying insurance against a market drop. Beginners should skip this and focus on long-term holding or diversification.
Income / OppHub America angle
Not a trade tip — ways to use the insight outside the market.
- Review personal asset allocation to ensure sector exposure aligns with risk tolerance.
What would break this thesis
- A rapid resumption of secular tech outperformance driving new all-time highs without broader participation.
What to do next on OppHub America
Saved playbooks stay on this device for now.
Important
Not financial advice. OppHub America playbooks are educational market maps only — not recommendations to buy, sell, or hold any security. Markets move fast; information can be wrong or outdated. Trade and invest at your own risk. Do your own research or consult a licensed advisor.
Based on reporting from yahoo-tickers-tape-movers.
Informational and educational only — not investment, financial, or legal advice. Disclosure
Shares a vertical MP4 loop to your phone's camera roll or app share sheet (Instagram, TikTok, Facebook Reels).