Barry, OppHub America Desk · · Source: yahoo-tickers-tape-movers
Verizon Forecasts: Valuations and Long-Term Earnings Projections
If growth models hold toward $147.7 billion in revenue by 2029, watch Verizon Communications as baseline cash generation supports fair value estimates near $51.58.
Based on reporting from yahoo-tickers-tape-movers.
As markets evaluate long-term telecom trajectories on Friday, October 9, 2026, Verizon Communications is being analyzed for its multi-year revenue and earnings potential through 2029. Investors are weighing baseline growth models against more conservative industry outlooks to gauge fair value upside.
Market context for this story
As of: After HoursLoading quotes…
Informational only — not investment advice. Full markets →


$SPYSPDR S&P 500 ETF
TradingView
Live chart & market data via TradingView · OppHub classroom · Delayed or exchange real-time per TradingView data agreements · Not investment advice
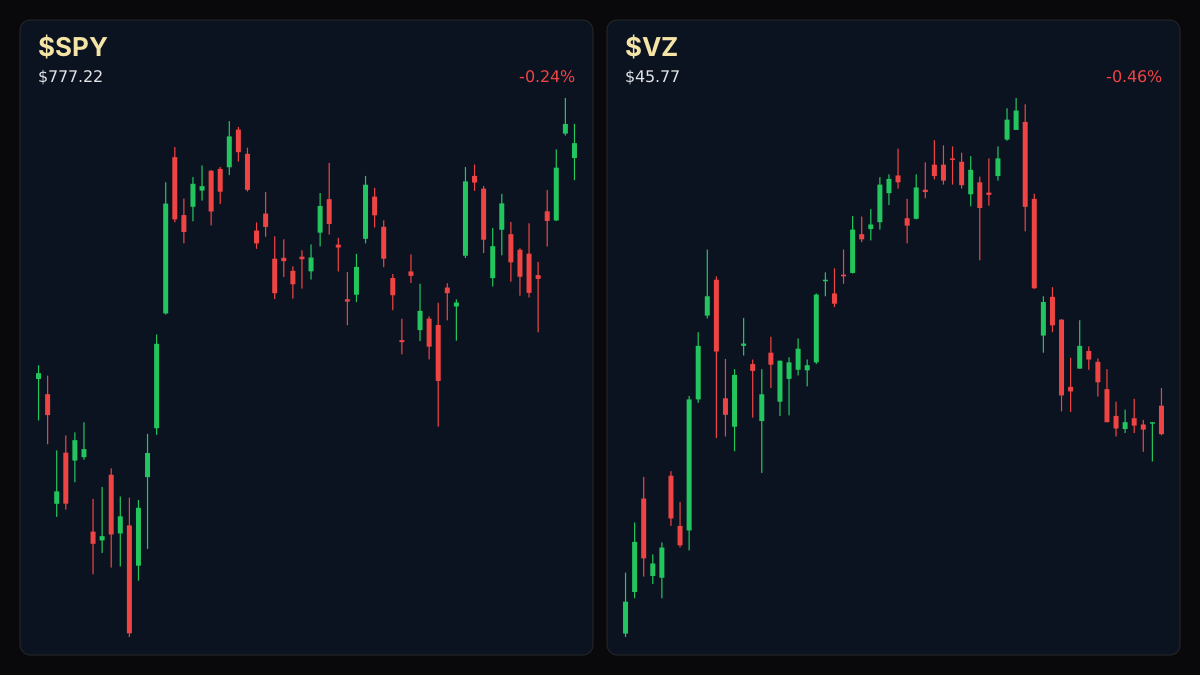
Educational TradingView chart — search any symbol in the widget. Confirm on /markets/SPY and related $VZ. Not investment advice.
Related markets
Shares a vertical MP4 loop to your phone's camera roll or app share sheet (Instagram, TikTok, Facebook Reels).
As markets evaluate long-term telecom trajectories on Friday, October 9, 2026, Verizon Communications ($VZ+WL) is being analyzed for its multi-year revenue and earnings potential through 2029. Long-term forecasting models project revenue reaching $147.7 billion and earnings hitting $23.0 billion by 2029, a trajectory that would require roughly 2.1% yearly revenue growth and an earnings increase of about $6.8 billion from current levels near $16.2 billion.
### Tape / Session Read While broader futures indices show mixed sessions—with S&P futures at 7,827.25 and Nasdaq futures at 30,992.00—telecom valuations remain tied to fundamental cash flow models and capital expenditure scrutiny. Alternative consensus forecasts point to a more cautious baseline of roughly US$143.8 billion in revenue and US$21.6 billion in earnings by 2029.
### Why This Lane Matters Long-term equity projections shape portfolio rebalancing and yield expectations across fixed-income alternatives and defensive large-cap holdings. Understanding the delta between optimistic growth assumptions and cautious terminal estimates helps market participants assess structural risk in mature dividend payers.
### Money Play If growth models hold toward $147.7 billion in revenue by 2029, watch Verizon Communications ($VZ+WL) as baseline cash generation supports its fair value targets near $51.58, representing potential upside from current valuation baselines.
Read the full story
Original reporting and related coverage — attribution links only, not paid recommendations.
Trade this story
 Robinhood
 Webull
 Tradier
 IBKR
IBKR
Chart this story
 TradingView
Broker and exchange buttons use invite / refer-a-friend links (rewards may be capped). Charting links (TradingView) are partner offers that may pay OppHub America a commission at no extra cost to you.
OppSHOP
Full OppSHOP →As an Amazon Associate, OppHub America earns from qualifying purchases. Shopping here helps keep the site free — at no extra cost to you. Disclosure

OppSHOP
Related to this story
If growth models hold toward $147.7 billion in revenue by 2029, watch Ve
Shop related →

Investing books
Read the classics
Shop this pick →

Personal finance books
Run the household books
Shop this pick →

Trading notebooks
Write the thesis first
Shop this pick →

Monitor for charts
See every pane
Shop this pick →
Story playbook
A pre-built map of what to watch — stocks, ETFs, and educational next steps. Not personalized advice.
Snapshot date: October 8, 2026 at 8:56 PM ET
This playbook was built when the story published and is not live-updated. Prices, news, and risk can change after this date — treat it as a starting map, not a current trade ticket.
Story → money map
telecom valuations and cash flow
Experts are looking at Verizon's future earnings and sales all the way out to 2029 to see if the stock is a good deal. If the company hits its growth goals, investors might see steady gains and reliable dividend payments.
What changed
Multi-year financial forecasts and cash flow projections for Verizon through 2029 have been released for market evaluation.
Who wins / who loses
Patient income investors and mature dividend payers benefit from stable cash generation, while aggressive growth seekers may be hurt by slow telecom expansion rates.
Time horizon
Think in terms of the next few months.
Confidence & best fit
medium confidence · Long-term investor
Safer theme exposure (ETFs)
Baskets that own the theme without betting on one company.
- $XTL — A basket of telecom stocks that lets you invest in the whole industry at once rather than just one company.
- $NOBL — A fund focused on reliable dividend-paying companies for safer, steady income.
Single stocks (higher risk)
Primary = closest to the story · Peers = same industry · Second-order = knock-on effects · Avoid = looks related but may be a trap
Primary
- $VZWatch — track, don’t rush
We are watching Verizon to see if its future sales and profits match up with its current stock price.
View $VZ chart → · End-of-day delayed data
Peer
- $TWatch — track, don’t rush
Competitors like AT&T move similarly based on how investors view the telecom industry's future.
View $T chart → · End-of-day delayed data
- $TMUSWatch — track, don’t rush
T-Mobile serves as a comparison point for how fast telecom companies are actually growing.
View $TMUS chart → · End-of-day delayed data
Options (education only)
No strikes or expiries — a framework for how traders might express the view. Options can expire worthless.
Direction: range · Style: Covered-call income (only if you already own shares) · Level: intermediate
Beginners should skip options here; a simple stock purchase for dividend income is safer and much easier to understand.
Income / OppHub America angle
Not a trade tip — ways to use the insight outside the market.
- Rebalancing fixed-income allocations in personal portfolios to match expected telecom yield trends.
What would break this thesis
- Significant downward revisions to baseline revenue forecasts below US$143.8 billion by 2029.
- Unexpected spikes in interest rates making dividend yields less attractive.
What to do next on OppHub America
Saved playbooks stay on this device for now.
Important
Not financial advice. OppHub America playbooks are educational market maps only — not recommendations to buy, sell, or hold any security. Markets move fast; information can be wrong or outdated. Trade and invest at your own risk. Do your own research or consult a licensed advisor.
Aftermath · $NVDA
-3.52% vs write
- •Since this piece: $NVDA is down -3.52% vs $238.90 at write time (now $230.48).
- •Session move (Yahoo delayed): -2.94%.
- •RSI14 at write was 84.6 — compare levels on Markets, not advice.
- •Original money play lens: If growth models hold toward $147.7 billion in revenue by 2029, watch Verizon Communications as baseline cash generation supports fair value estimates near $51.58.
- •Track $NVDA live on OppHub Markets (/markets/NVDA). Not financial advice.
Based on reporting from yahoo-tickers-tape-movers.
Informational and educational only — not investment, financial, or legal advice. Disclosure
Shares a vertical MP4 loop to your phone's camera roll or app share sheet (Instagram, TikTok, Facebook Reels).