Barry, OppHub America Desk · · Source: yahoo-megacap-tickers
Market Hits Record Highs Amid Investor Uncertainty: Buffett Indicator Signals Risk
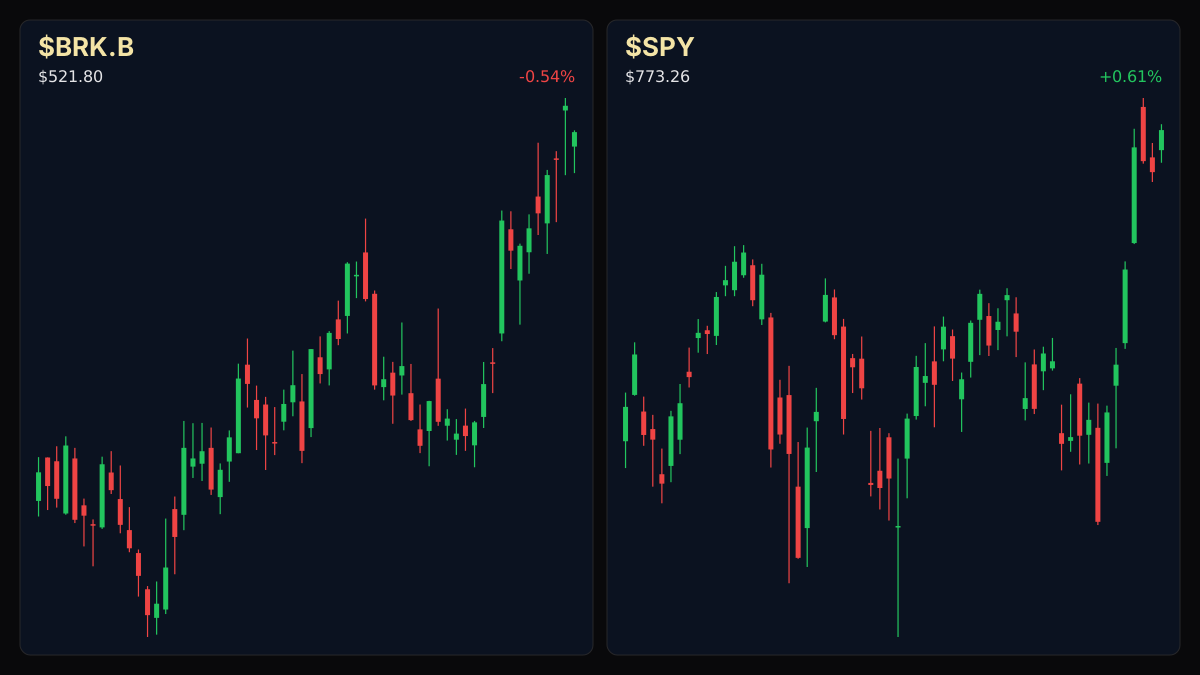
- Focus on quality companies with sustainable business models and strong financials, especially in the face of high valuation metrics. - While the S&P 500 () shows an oversold RSI14 of 30.7, elevated metrics like the Buffett indicator suggest caution. - Berkshire Hathaway Class B shares () exhibit a neutral-to-bullish RSI14 of 65.9, indicating potential for continued stability.
Based on reporting from yahoo-megacap-tickers.
Major U.S. equity indexes have reached new record highs, yet investor sentiment remains divided. The Buffett indicator, a valuation metric, has reached its highest recorded level, signaling potential market risk despite broad market gains.
Market context for this story
As of: WeekendLoading quotes…
Informational only — not investment advice. Full markets →


$SPYSPDR S&P 500 ETF
TradingView
Live chart & market data via TradingView · OppHub classroom · Delayed or exchange real-time per TradingView data agreements · Not investment advice
Educational TradingView chart — search any symbol in the widget. Confirm on /markets/SPY and related $BRK.B, $BRK. Not investment advice.
Related markets
Shares a vertical MP4 loop to your phone's camera roll or app share sheet (Instagram, TikTok, Facebook Reels).
**Implied Volatility / Movement:** Major U.S. equity indexes are surging, with the S&P 500 and Dow Jones Industrial Average both hitting record highs. Despite these advances, investor sentiment is mixed, with a significant portion expressing pessimism about the market's near-term outlook.
### Money Play While broad market indexes like the S&P 500 ($SPY+WL) have seen recent gains, elevated valuation metrics suggest caution. Investors may consider focusing on quality companies with strong fundamentals and a long-term perspective to navigate potential volatility. The Berkshire Hathaway Class B shares ($BRK.B+WL) currently show a RSI14 of 65.9, indicating a neutral-to-bullish technical stance, while the broader market ETF ($SPY+WL) has an RSI14 of 30.7, suggesting oversold conditions.
### Executive Thesis Record highs in major stock indices are occurring alongside a divergence in investor sentiment and elevated valuation metrics. Historical indicators suggest potential overvaluation and a risk of future pullbacks, emphasizing the importance of a long-term investment strategy focused on quality and resilience.
### The Print Recent market performance shows the S&P 500 up 0.62% and the Dow Jones Industrial Average up 0.28%, reaching new record highs. Investor sentiment surveys indicate 37% feel optimistic, 38% feel pessimistic, and 25% are neutral about the market's future.
### Market Reaction No specific market reaction data beyond the reported index movements is available ### What It Means for Policy & Positioning While the current market surge reflects strong performance, the underlying valuation concerns and mixed investor sentiment do not directly imply an immediate shift in Federal Reserve policy. However, persistent overvaluation could eventually influence long-term economic stability considerations for policymakers.
### Next Calendar Watch No upcoming related calendar events are specified
Read the full story
Original reporting and related coverage — attribution links only, not paid recommendations.
Trade this story
 Robinhood
 Webull
 Tradier
 IBKR
IBKR
Chart this story
 TradingView
Broker and exchange buttons use invite / refer-a-friend links (rewards may be capped). Charting links (TradingView) are partner offers that may pay OppHub America a commission at no extra cost to you.
OppSHOP
Full OppSHOP →As an Amazon Associate, OppHub America earns from qualifying purchases. Shopping here helps keep the site free — at no extra cost to you. Disclosure

OppSHOP
Related to this story
- Focus on quality companies with sustainable business models and strong
Shop related →

Investing books
Read the classics
Shop this pick →

Personal finance books
Run the household books
Shop this pick →

Trading notebooks
Write the thesis first
Shop this pick →

Monitor for charts
See every pane
Shop this pick →
Story playbook
A pre-built map of what to watch — stocks, ETFs, and educational next steps. Not personalized advice.
Snapshot date: August 9, 2026 at 8:11 PM ET
This playbook was built when the story published and is not live-updated. Prices, news, and risk can change after this date — treat it as a starting map, not a current trade ticket.
Story → money map
market valuation risk
The stock market reached record highs, but a famous valuation tool warns that stocks might be too expensive. Beginners should focus on financially stable, high-quality companies rather than chasing speculative rallies.
What changed
Major stock indexes hit record highs while valuation metrics like the Buffett indicator reached all-time highs, highlighting a disconnect between prices and fundamental value.
Who wins / who loses
Quality companies and cash-rich conglomerates benefit from defensive flight, while overvalued, speculative growth names face potential correction risks.
Time horizon
Think in terms of the next few months.
Confidence & best fit
medium confidence · Long-term investor
Safer theme exposure (ETFs)
Baskets that own the theme without betting on one company.
Single stocks (higher risk)
Primary = closest to the story · Peers = same industry · Second-order = knock-on effects · Avoid = looks related but may be a trap
Primary
- $BRK.BBuild slowly — only if it fits your plan
Berkshire Hathaway is known for holding cash and buying solid businesses, making it a safe place when stocks get too expensive.
View $BRK.B chart → · End-of-day delayed data
Peer
- $JNJWatch — track, don’t rush
Healthcare stocks often hold up well when the broader stock market gets shaky because people always need medicine.
View $JNJ chart → · End-of-day delayed data
Second-order
- $WMTWatch — track, don’t rush
Retailers that sell everyday essentials tend to stay steady even when the stock market goes through rough patches.
View $WMT chart → · End-of-day delayed data
Options (education only)
No strikes or expiries — a framework for how traders might express the view. Options can expire worthless.
Direction: volatile · Style: Protective put / downside hedge idea · Level: intermediate
Think of this like buying insurance on your stock portfolio in case the market drops; beginners should generally skip this.
Income / OppHub America angle
Not a trade tip — ways to use the insight outside the market.
- Build cash reserves to take advantage of potential market pullbacks.
What would break this thesis
- Sustained earnings growth across major sectors that justifies elevated valuation multiples.
What to do next on OppHub America
Saved playbooks stay on this device for now.
Important
Not financial advice. OppHub America playbooks are educational market maps only — not recommendations to buy, sell, or hold any security. Markets move fast; information can be wrong or outdated. Trade and invest at your own risk. Do your own research or consult a licensed advisor.
Based on reporting from yahoo-megacap-tickers.
Informational and educational only — not investment, financial, or legal advice. Disclosure
Shares a vertical MP4 loop to your phone's camera roll or app share sheet (Instagram, TikTok, Facebook Reels).