Barry, OppHub America Desk · · Source: yahoo-tickers-tape-movers
Vanguard Growth ETF Performance vs S&P 500: Lagging Year Analysis
Review portfolio concentration in mega-cap growth weightings and monitor interest rate trajectories relative to historical fund drawdowns.
Based on reporting from yahoo-tickers-tape-movers.
The Vanguard Morningstar Growth ETF has lagged the S&P 500 in 2026, dropping about 6% from its October peak while historical backtests suggest rebound patterns after slow years. Traders tracking sector concentration and macroeconomic interest rate shifts face diverging momentum across mega-cap leaders.
Market context for this story
As of: After HoursLoading quotes…
Informational only — not investment advice. Full markets →


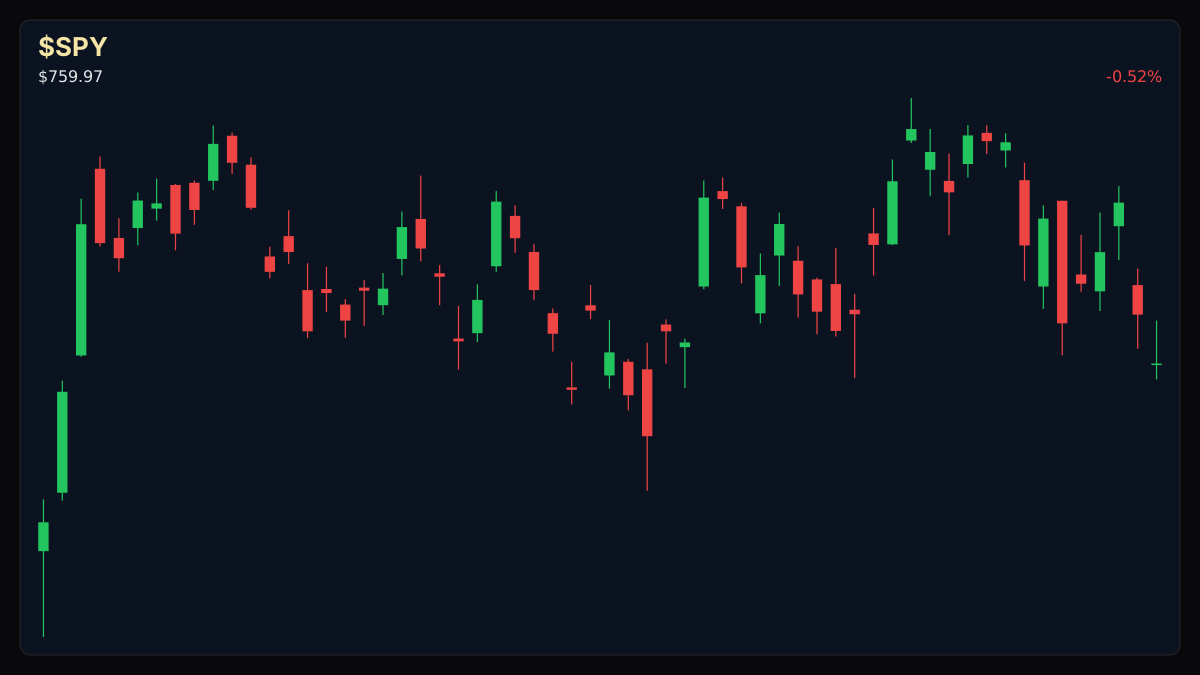
$SPYSPDR S&P 500 ETF
TradingView
Live chart & market data via TradingView · OppHub classroom · Delayed or exchange real-time per TradingView data agreements · Not investment advice
Educational TradingView chart — search any symbol in the widget. Confirm on /markets/SPY and related $NVDA. Not investment advice.
Related markets
Shares a vertical MP4 loop to your phone's camera roll or app share sheet (Instagram, TikTok, Facebook Reels).
### Session Tape — Vanguard Morningstar Growth ETF (VUG +0.89%) and S&P 500 (^GSPC +0.70%)
## Catalyst Analysis: Growth Fund Lag and Macro headwinds The Vanguard Morningstar Growth ETF (VUG +0.89%) set a record on Oct. 6, closing at $92.64 before sliding roughly 6% to about $87. This contraction leaves the growth fund up approximately 7% in 2026, compared to an 11% gain for the broader S&P 500 (^GSPC +0.70%) over the same stretch. Historical tracking from 2005 to 2025 indicates that the fund historically rebounded after lagging full calendar years, showing a historical win rate of around 76% following a down relative year. However, elevated benchmark rates—such as the Federal Reserve shifting its target rate to a range of 3.75% to 4%—continue to pressure growth valuations.
## Market Structure and Concentration Risk Portfolio weighting remains heavily skewed toward top holdings, with the ten largest positions comprising about 66% of assets, compared to roughly 41% for the Vanguard S&P 500 ETF. Mega-cap performance has split, with Nvidia representing roughly 13.5% of assets while trading below its October record. Historical analogues, such as the 34% drawdown seen in 2021 when the Federal Reserve raised benchmark rates toward 4.5%, highlight how sensitivity to monetary tightening dictates growth-to-index performance gaps.
### Money Play Market participants should evaluate portfolio concentration risks and duration sensitivity as rate policies shift across equity benchmarks.
Read the full story
Original reporting and related coverage — attribution links only, not paid recommendations.
Trade this story
 Robinhood
 Webull
 Tradier
 IBKR
Chart this story
 TradingView
Broker and exchange buttons use invite / refer-a-friend links (rewards may be capped). Charting links (TradingView) are partner offers that may pay OppHub America a commission at no extra cost to you.
OppSHOP
Full OppSHOP →As an Amazon Associate, OppHub America earns from qualifying purchases. Shopping here helps keep the site free — at no extra cost to you. Disclosure

OppSHOP
Related to this story
Review portfolio concentration in mega-cap growth weightings and monitor
Shop related →

Investing books
Read the classics
Shop this pick →

Personal finance books
Run the household books
Shop this pick →

Trading notebooks
Write the thesis first
Shop this pick →

Monitor for charts
See every pane
Shop this pick →
Story playbook
A pre-built map of what to watch — stocks, ETFs, and educational next steps. Not personalized advice.
Snapshot date: October 26, 2026 at 9:26 PM ET
This playbook was built when the story published and is not live-updated. Prices, news, and risk can change after this date — treat it as a starting map, not a current trade ticket.
Story → money map
growth fund lag and concentration risk
Growth-focused investments have grown slower than the broader market this year due to higher borrowing costs. Investors are watching to see if these high-flying tech stocks can bounce back like they have historically.
What changed
The Vanguard Growth ETF has dropped about 6% from its October peak, lagging the broader S&P 500 amid higher interest rates.
Who wins / who loses
Broader market indexes and diversified funds benefit from the rotation, while highly concentrated mega-cap growth funds and top tech holdings face pressure.
Time horizon
Think in terms of the next few months.
Confidence & best fit
medium confidence · Long-term investor, Active trader
Safer theme exposure (ETFs)
Baskets that own the theme without betting on one company.
Single stocks (higher risk)
Primary = closest to the story · Peers = same industry · Second-order = knock-on effects · Avoid = looks related but may be a trap
Primary
- $VUGWatch — track, don’t rush
This is the exact growth fund mentioned in the story that is trailing the broader market.
Peer
- $NVDAWatch — track, don’t rush
This massive tech stock makes up a huge chunk of the growth fund and heavily influences its price.
View $NVDA chart → · End-of-day delayed data
Options (education only)
No strikes or expiries — a framework for how traders might express the view. Options can expire worthless.
Direction: volatile · Style: Protective put / downside hedge idea · Level: intermediate
Think of this like buying insurance on your tech investments in case the market drops further. Beginners should probably skip options and focus on holding cash or diversified funds.
Income / OppHub America angle
Not a trade tip — ways to use the insight outside the market.
- Rebalance portfolio allocations to reduce over-concentration in top-heavy mega-cap positions.
What would break this thesis
- A rapid drop in benchmark interest rates sparking a sharp rebound in mega-cap growth valuations.
What to do next on OppHub America
Saved playbooks stay on this device for now.
Important
Not financial advice. OppHub America playbooks are educational market maps only — not recommendations to buy, sell, or hold any security. Markets move fast; information can be wrong or outdated. Trade and invest at your own risk. Do your own research or consult a licensed advisor.
Based on reporting from yahoo-tickers-tape-movers.
Informational and educational only — not investment, financial, or legal advice. Disclosure
Shares a vertical MP4 loop to your phone's camera roll or app share sheet (Instagram, TikTok, Facebook Reels).