Barry, OppHub America Desk · · Source: yahoo-tickers-tape-movers
Warren Buffett Index Strategy: S&P 500 Returns and $500 Monthly
Housing & mortgages: Rate and housing policy spill into builders, small-caps, and REITs.
Based on reporting from yahoo-tickers-tape-movers.
Warren Buffett's historical compounding rate at Berkshire Hathaway highlights the power of long-term indexing, prompting a look at what $500 monthly allocations yield over 20 years across different return scenarios. As macroeconomic GDP growth tracks at a nominal 4.4% rate alongside valuation metrics like the CAPE ratio expanding by 51% over two decades, index investing remains a focal point for long-term capital allocation.
Market context for this story
As of: After HoursLoading quotes…
Informational only — not investment advice. Full markets →


$SPYSPDR S&P 500 ETF
TradingView
Live chart & market data via TradingView · OppHub classroom · Delayed or exchange real-time per TradingView data agreements · Not investment advice
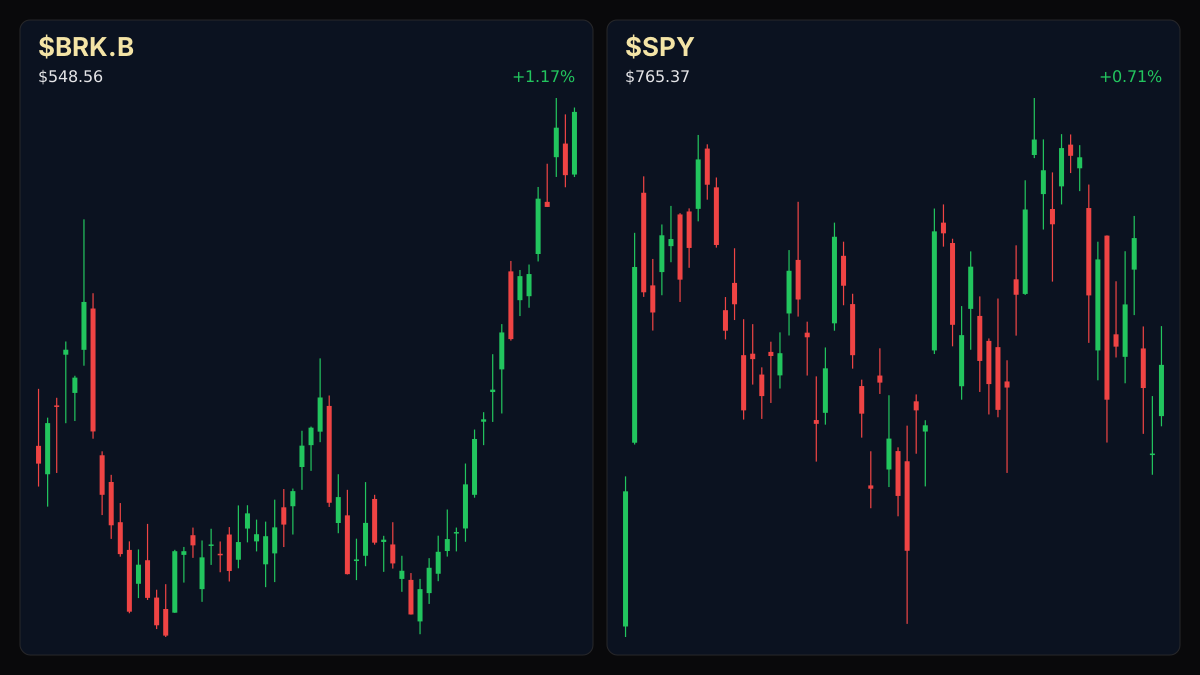
Educational TradingView chart — search any symbol in the widget. Confirm on /markets/SPY and related $BRK.B. Not investment advice.
Related markets
Shares a vertical MP4 loop to your phone's camera roll or app share sheet (Instagram, TikTok, Facebook Reels).
### Money Play - Housing & mortgages: Rate and housing policy spill into builders, small-caps, and REITs.
### Session Tape — S&P 500 +0.7%, Dow Jones +0.3%, Nasdaq +0.8%, Bitcoin -0.7%
## Catalyst Analysis: Berkshire Compounding vs. Indexing Warren Buffett directed capital allocation decisions that compounded Berkshire Hathaway's stock price at a rate of nearly 20% per year over six decades, nearly doubling historical S&P 500 returns. Despite this record, the Oracle of Omaha's approach for wealth building centers on simple index vehicles. Analytical metrics show nominal GDP growth at 4.4%, while broader valuation measures like the CAPE ratio expanded by 51% over the past 20 years, framing the backdrop for prospective returns.
## Long-Term Return Projections Allocating $500 a month over a 20-year horizon yields distinct terminal values depending on the annualized rate of return: - At a 5% annualized rate, the investment grows to $205,000. - At a 10% annualized rate, the investment reaches $364,000. - At a 15% annualized rate, the capital expands to $669,000.
These projections underscore the sensitivity of compounding outcomes to return rates, especially when historical S&P 500 annualized total returns have averaged approximately 10% over extended market cycles.
Read the full story
Original reporting and related coverage — attribution links only, not paid recommendations.
Trade this story
 Robinhood
 Webull
 Tradier
 IBKR
Chart this story
 TradingView
Broker and exchange buttons use invite / refer-a-friend links (rewards may be capped). Charting links (TradingView) are partner offers that may pay OppHub America a commission at no extra cost to you.
OppSHOP
Full OppSHOP →As an Amazon Associate, OppHub America earns from qualifying purchases. Shopping here helps keep the site free — at no extra cost to you. Disclosure

OppSHOP
Related to this story
Housing & mortgages: Rate and housing policy spill into builders, small-
Shop related →

Investing books
Read the classics
Shop this pick →

Personal finance books
Run the household books
Shop this pick →

Trading notebooks
Write the thesis first
Shop this pick →

Monitor for charts
See every pane
Shop this pick →
Story playbook
A pre-built map of what to watch — stocks, ETFs, and educational next steps. Not personalized advice.
Snapshot date: October 27, 2026 at 3:07 AM ET
This playbook was built when the story published and is not live-updated. Prices, news, and risk can change after this date — treat it as a starting map, not a current trade ticket.
Story → money map
long-term indexing and wealth compounding
Warren Buffett's famous investing success shows that putting money regularly into the stock market over many years helps it grow significantly. Beginners should care because steady, long-term saving in broad market funds is often safer and easier than trying to pick single winning stocks.
What changed
Analysis of historical Berkshire compounding and S&P 500 indexing models highlights the long-term terminal value of monthly capital allocations under various return scenarios.
Who wins / who loses
Broad index funds and disciplined long-term savers benefit from steady compounding, while high-fee active managers and cash-heavy investors risk missing out on long-term growth.
Time horizon
Think in terms of the next few months.
Confidence & best fit
high confidence · Long-term investor, Side income / builder
Safer theme exposure (ETFs)
Baskets that own the theme without betting on one company.
- $VOO — An exchange-traded fund that buys a little piece of the 500 biggest U.S. companies all at once.
- $RSP — A fund that gives equal importance to every company in the index rather than letting the largest ones dominate.
- $VNQ — A basket of real estate properties and landlords that helps diversify beyond regular stocks.
- $IWM — A fund tracking smaller American companies that often respond strongly to changing interest rates.
Single stocks (higher risk)
Primary = closest to the story · Peers = same industry · Second-order = knock-on effects · Avoid = looks related but may be a trap
Primary
- $BRK.BBuild slowly — only if it fits your plan
Warren Buffett's company is a giant mix of stable businesses that historically grows wealth steadily over time.
View $BRK.B chart → · End-of-day delayed data
Options (education only)
No strikes or expiries — a framework for how traders might express the view. Options can expire worthless.
Beginners should skip options completely for this strategy; slow, steady investing works best without complicated financial bets.
See options-friendly brokers →Income / OppHub America angle
Not a trade tip — ways to use the insight outside the market.
- Automate monthly contributions into a low-cost brokerage account to remove emotional decision-making from investing.
What would break this thesis
- A prolonged structural regime of sharply higher inflation and negative real economic growth.
What to do next on OppHub America
Saved playbooks stay on this device for now.
Important
Not financial advice. OppHub America playbooks are educational market maps only — not recommendations to buy, sell, or hold any security. Markets move fast; information can be wrong or outdated. Trade and invest at your own risk. Do your own research or consult a licensed advisor.
Based on reporting from yahoo-tickers-tape-movers.
Informational and educational only — not investment, financial, or legal advice. Disclosure
Shares a vertical MP4 loop to your phone's camera roll or app share sheet (Instagram, TikTok, Facebook Reels).