Barry, OppHub America Desk · · Source: seeking-alpha
Wells Fargo Q3 Print: Net Interest Income Rises to $12.5B
Income-focused investors can evaluate preferred share options like . yielding 7.10% to capture higher fixed-income returns during rate volatility.
Based on reporting from seeking-alpha.
Wells Fargo reported mixed third-quarter results on Sunday, October 18, 2026, featuring an earnings per share beat alongside a revenue miss while net interest income rose to $12.5 billion. Investors weighing the flat weekly share performance are exploring income alternatives such as preferred shares yielding over 7% amidst broader rate volatility.
Market context for this story
As of: WeekendLoading quotes…
Informational only — not investment advice. Full markets →


$XLFFinancial Select Sector
TradingView
Live chart & market data via TradingView · OppHub classroom · Delayed or exchange real-time per TradingView data agreements · Not investment advice
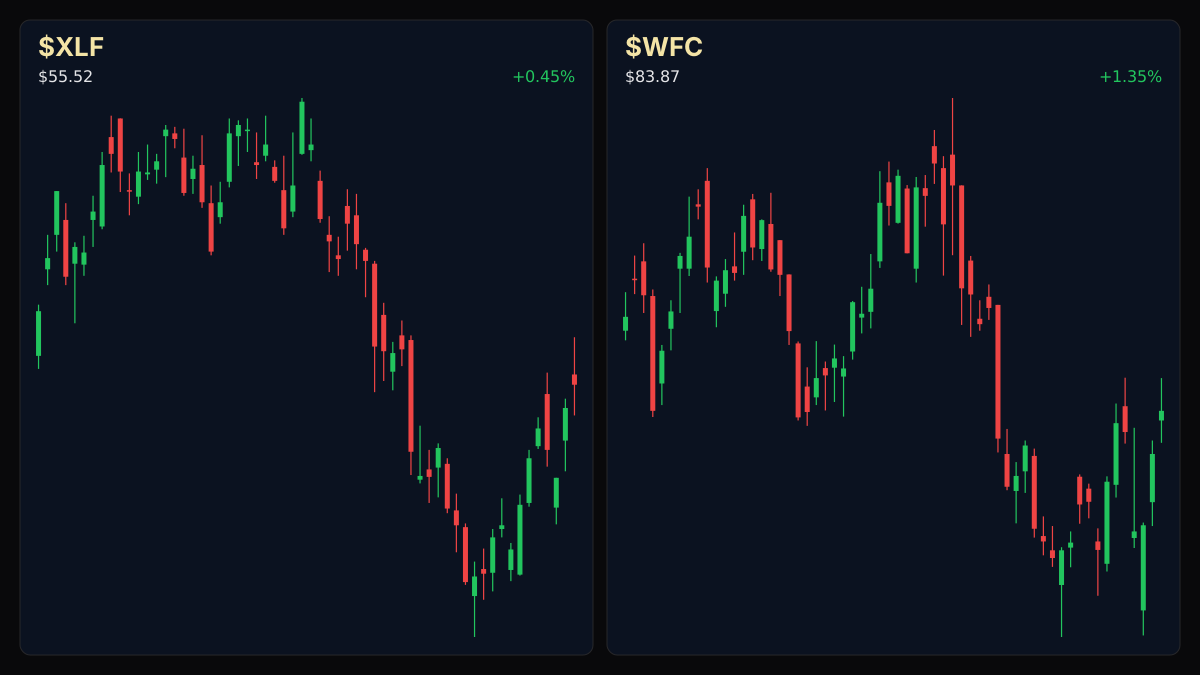
Educational TradingView chart — search any symbol in the widget. Confirm on /markets/XLF and related $WFC. Not investment advice.
Related markets
Shares a vertical MP4 loop to your phone's camera roll or app share sheet (Instagram, TikTok, Facebook Reels).
Wells Fargo reported mixed third-quarter results on Sunday, October 18, 2026, highlighted by a net interest income increase to $12.5 billion alongside a conservative loan-to-deposit ratio.
### Money Play Income-focused investors examining fixed-income alternatives in the banking sector can evaluate preferred share yields such as $WFC+WL.PZ at 7.10% as a way to capture higher returns during periods of rate volatility.
## Catalyst Analysis: Q3 Print and Net Interest Dynamics The institution posted mixed third-quarter metrics featuring an earnings-per-share beat alongside a revenue shortfall, leaving shares flat for the week. Net interest margin held steady at 2.43% as asset and borrowing yields shifted, lifting net interest income by $200 million to reach $12.5 billion.
Loan growth advanced 1.7% over the quarter and 11% compared to the prior-year period, while deposits increased at a moderate pace. This preserved a conservative 69% loan-to-deposit ratio across the balance sheet, supporting stability within core lending operations despite uneven quarterly top-line momentum.
## Technical Analysis & Key Risk Watch
Market participants tracking broader financial sector sentiment and rate-sensitive equities continue to monitor valuation multiples and yield spreads across large-cap banking institutions following the latest earnings reports.
### Sector Ripple / Impact on Financials Sector dynamics across major banking institutions reflect ongoing adjustments to net interest margins and loan demand as firms navigate shifting yield environments and capital requirements.
Read the full story
Original reporting and related coverage — attribution links only, not paid recommendations.
Trade this story
 Robinhood
 Webull
 Tradier
 IBKR
IBKR
Chart this story
 TradingView
Broker and exchange buttons use invite / refer-a-friend links (rewards may be capped). Charting links (TradingView) are partner offers that may pay OppHub America a commission at no extra cost to you.
OppSHOP
Full OppSHOP →As an Amazon Associate, OppHub America earns from qualifying purchases. Shopping here helps keep the site free — at no extra cost to you. Disclosure

OppSHOP
Related to this story
Income-focused investors can evaluate preferred share options like . yie
Shop related →

Investing books
Read the classics
Shop this pick →

Personal finance books
Run the household books
Shop this pick →

Trading notebooks
Write the thesis first
Shop this pick →

Monitor for charts
See every pane
Shop this pick →
Story playbook
A pre-built map of what to watch — stocks, ETFs, and educational next steps. Not personalized advice.
Snapshot date: October 18, 2026 at 11:26 AM ET
This playbook was built when the story published and is not live-updated. Prices, news, and risk can change after this date — treat it as a starting map, not a current trade ticket.
Story → money map
bank earnings and fixed income yields
Wells Fargo reported a mixed quarter where profit beat expectations, but total revenue fell slightly short. Investors looking for steady income are paying attention to the bank's special preferred stocks that pay solid yields above 7 percent.
What changed
Wells Fargo reported mixed Q3 earnings with higher net interest income while maintaining a conservative loan-to-deposit ratio.
Who wins / who loses
Large banks with steady net interest income win, while top-line revenue growth laggards face near-term pressure.
Time horizon
Think in terms of the next few months.
Confidence & best fit
medium confidence · Long-term investor
Safer theme exposure (ETFs)
Baskets that own the theme without betting on one company.
Single stocks (higher risk)
Primary = closest to the story · Peers = same industry · Second-order = knock-on effects · Avoid = looks related but may be a trap
Primary
- $WFCWatch — track, don’t rush
Wells Fargo made good profit from interest, but overall sales missed expectations.
View $WFC chart → · End-of-day delayed data
Peer
- $BACWatch — track, don’t rush
Other big banks are watched closely to see if they face similar revenue challenges.
View $BAC chart → · End-of-day delayed data
- $JPMWatch — track, don’t rush
The largest bank sets the standard for how the rest of the banking sector is performing.
View $JPM chart → · End-of-day delayed data
Options (education only)
No strikes or expiries — a framework for how traders might express the view. Options can expire worthless.
Direction: volatile · Style: Covered-call income (only if you already own shares) · Level: intermediate
Beginners should skip options and focus on owning the stock or preferred shares for steady dividend income.
Income / OppHub America angle
Not a trade tip — ways to use the insight outside the market.
- Evaluate preferred shares yielding over 7 percent for income generation during rate volatility.
What would break this thesis
- Sharp declines in net interest margin or unexpected deterioration in loan quality.
What to do next on OppHub America
Saved playbooks stay on this device for now.
Important
Not financial advice. OppHub America playbooks are educational market maps only — not recommendations to buy, sell, or hold any security. Markets move fast; information can be wrong or outdated. Trade and invest at your own risk. Do your own research or consult a licensed advisor.
Based on reporting from seeking-alpha.
Informational and educational only — not investment, financial, or legal advice. Disclosure
Shares a vertical MP4 loop to your phone's camera roll or app share sheet (Instagram, TikTok, Facebook Reels).